


ہمارے ٹیم میں 7000000 سے ذائد تاجران شامل ہیں
ہم تجارت کی بہتری کے لئے ہر روز اکھٹے کام کرتے ہیں اور بہترین نتائج حاصل کرتے ہوئے آگے کی جانب بڑھتے ہیں
دُنیا بھر سے سے لاکھوں ہمارے بہترین کام کو سند عطاء کرتے ہیں آپ اپنا انتحاب کریں باقی ہم آپ کی توقعات پر پورا اترنے کے لئے اپنی بہترین کوشش کریں گے
ہم مل کر ایک بہترین ٹیم بناتے ہیں
انسٹا فاریکس آپ سے کام کرتے ہوئے فخر محسوس کرتا ہے


ایکٹر - یو سی ایف 6 ٹورنامنٹ چیمپین اور واقعی ہیرو
ایک فرد کے جس نے اپنا آپ منوایا ہے وہ فرد کہ جو ہماری راہ پر چلا ہے.
ٹکٹا روو کی کامیابی کا راز یہ ہے کہ وہ اپنے اہداف کی جانب مسلسل بڑھتا رہتا ہے
اپنے ہنر یا ٹیلنٹ کے تمام پہلو آشکار کررہے ہیں
پہچانیں ، کوشش کریں ، ناکام ہوں لیکن کبھی نہ رُکیں
انسٹا فاریکس آپ کی کامیابی کی کہاں یہاں سے شروع ہوتی ہے

Bitcoin held its ground yesterday and rose slightly during American trading, looking relatively good amid the onset of a new global energy crisis. Ethereum remains below the $2,000 level, indicating its weakness and limiting its upward potential.

If Bitcoin and the major assets are clear, let's look at what is happening in the altcoin market. Data from CryptoQuant paints a concerning picture: a total of 38% of altcoins are near their historical lows. This suggests a deep and prolonged decline that has affected a significant portion of digital assets, apart from perhaps the largest players. The overall atmosphere in the financial markets remains unfavorable for risk assets, including altcoins. There is a clear outflow of liquidity toward more traditional, and, as investors believe, safer, asset classes. Metals, despite strong volatility, and commodities influenced by global macroeconomic factors, such as energy prices, are currently attracting more investor attention. This keeps altcoins under strong selling pressure, exacerbating their downward trend in value.
Such a reallocation of capital suggests that investors are currently focused on minimizing risks and postponing more speculative investments. Amid overall economic uncertainty and potential geopolitical threats stemming from the war in Iran, money is flowing into safer havens. For the altcoin market, this means continued stagnation or even further declines until overall market conditions radically change.
The 38% indicator represents the largest drop in this current cycle. For comparison, in April 2025, this figure was 35%, and immediately after the FTX collapse, it was 37.8%.
As for the intraday strategy in the cryptocurrency market, I will continue to rely on major pullbacks in Bitcoin and Ethereum in anticipation of a long-term bullish market, which has not gone away.
As for short-term trading, the strategy and conditions are described below.
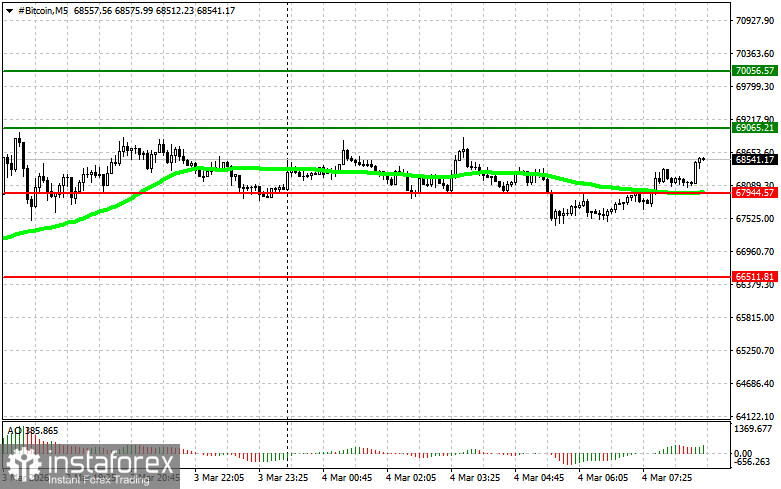
Scenario No. 1: I will buy Bitcoin today if the entry point reaches around $69,000, targeting a price of $70,000. At around $70,000, I plan to exit my purchases and sell immediately on a pullback. Before buying on the breakout, ensure that the 50-day moving average is below the current price and the Awesome indicator is above zero.
Scenario No. 2: I can buy Bitcoin at the lower boundary at $67,900 if there is no market reaction to its breakout back to $69,000 and $70,000.
Scenario No. 1: I will sell Bitcoin today if the entry point reaches around $67,900, targeting a drop to $66,500. At around $66,500, I plan to exit my sales and buy immediately on a pullback. Before selling on the breakout, ensure that the 50-day moving average is above the current price and the Awesome indicator is below zero.
Scenario No. 2: I can sell Bitcoin from the upper boundary at $69,000 if there is no market reaction to its breakout back to levels of $67,900 and $66,500.
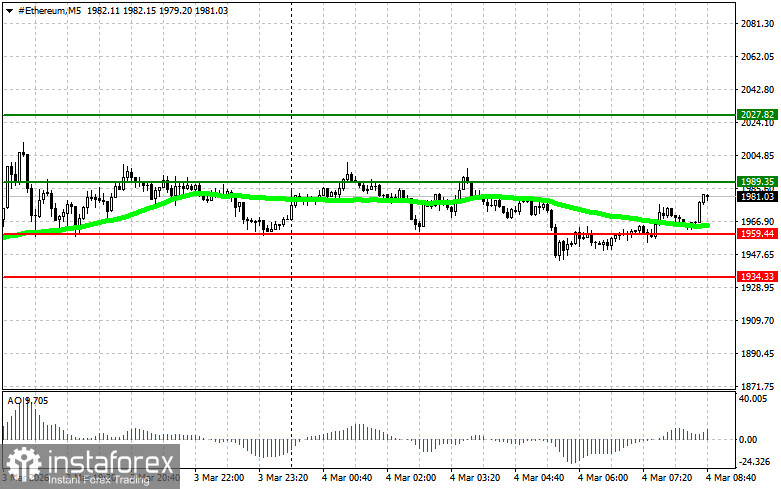
Scenario No. 1: I will buy Ethereum today if the entry point reaches around $1,989, targeting a move to $2,027. At around $2,072, I plan to exit my purchases and sell immediately on a pullback. Before buying on the breakout, ensure that the 50-day moving average is below the current price and the Awesome indicator is above zero.
Scenario No. 2: I can buy Ethereum at the lower boundary at $1,959 if there is no market reaction to its breakout back to $1,989 and $2,027.
Scenario No. 1: I will sell Ethereum today if the entry point reaches around $1,959, targeting a drop to $1,934. At around $1,934, I plan to exit my sales and buy immediately on a pullback. Before selling on the breakout, ensure that the 50-day moving average is above the current price and the Awesome indicator is below zero.
Scenario No. 2: I can sell Ethereum at the upper boundary at $1,989 if there is no market reaction to its breakout back to $1,959 and $1,934.
*تعینات کیا مراد ہے مارکیٹ کے تجزیات یہاں ارسال کیے جاتے ہیں جس کا مقصد آپ کی بیداری بڑھانا ہے، لیکن تجارت کرنے کے لئے ہدایات دینا نہیں.
InstaSpot analytical reviews will make you fully aware of market trends! Being an InstaSpot client, you are provided with a large number of free services for efficient trading.


