


ہمارے ٹیم میں 7000000 سے ذائد تاجران شامل ہیں
ہم تجارت کی بہتری کے لئے ہر روز اکھٹے کام کرتے ہیں اور بہترین نتائج حاصل کرتے ہوئے آگے کی جانب بڑھتے ہیں
دُنیا بھر سے سے لاکھوں ہمارے بہترین کام کو سند عطاء کرتے ہیں آپ اپنا انتحاب کریں باقی ہم آپ کی توقعات پر پورا اترنے کے لئے اپنی بہترین کوشش کریں گے
ہم مل کر ایک بہترین ٹیم بناتے ہیں
انسٹا فاریکس آپ سے کام کرتے ہوئے فخر محسوس کرتا ہے


ایکٹر - یو سی ایف 6 ٹورنامنٹ چیمپین اور واقعی ہیرو
ایک فرد کے جس نے اپنا آپ منوایا ہے وہ فرد کہ جو ہماری راہ پر چلا ہے.
ٹکٹا روو کی کامیابی کا راز یہ ہے کہ وہ اپنے اہداف کی جانب مسلسل بڑھتا رہتا ہے
اپنے ہنر یا ٹیلنٹ کے تمام پہلو آشکار کررہے ہیں
پہچانیں ، کوشش کریں ، ناکام ہوں لیکن کبھی نہ رُکیں
انسٹا فاریکس آپ کی کامیابی کی کہاں یہاں سے شروع ہوتی ہے


The EUR/CAD cross rate is attempting to recover from Wednesday's losses, as the commodity-linked Canadian dollar struggles amid falling oil prices, given Canada's status as the largest oil exporter. West Texas Intermediate (WTI) oil prices dropped after a four-day rise, nearly losing Wednesday's gain.
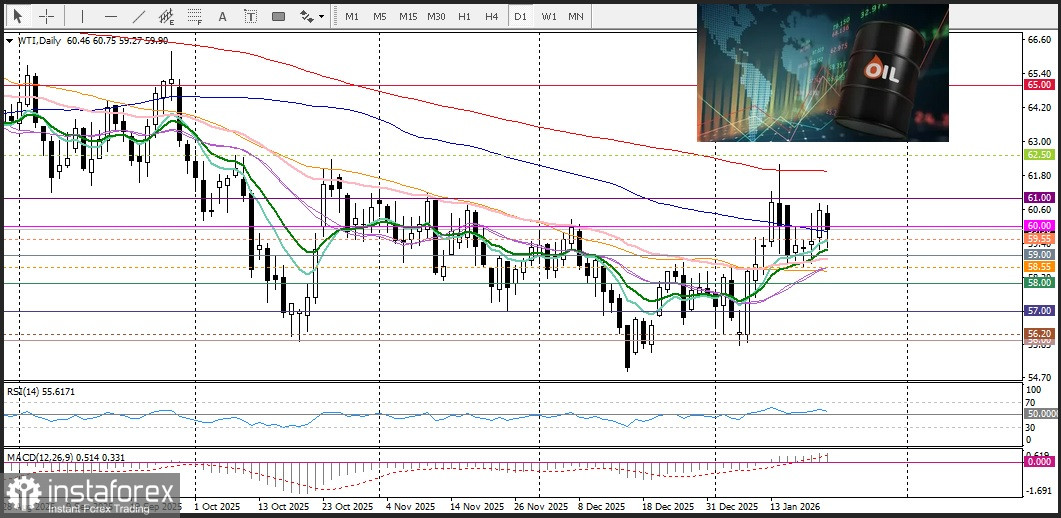
Oil prices are under pressure from the risk of oversupply, with the International Energy Agency (IEA) confirming a significant surplus of global supply over demand this year, despite a moderate adjustment to demand growth forecasts. Industry data also showed an increase of about 3 million barrels in U.S. crude oil inventories last week. Market participants should also pay attention to the monthly retail sales data in Canada, forecasting growth of 1.2% in November after a 0.2% decline in October, while retail sales excluding automobiles are expected to grow by 1.4% compared to a 0.6% decline.
The EUR/CAD exchange rate could strengthen amid support for the euro amid easing concerns over the trade war between the U.S. and the European Union. U.S. President Donald Trump announced the abandonment of tariffs on goods from European countries opposing his plans for Greenland. Trump also noted that the United States and the North Atlantic Treaty Organization (NATO) have laid the groundwork for a future agreement on Greenland, although the parameters of this so-called groundwork remain uncertain.
From a technical perspective, on the hourly chart, the pair is struggling to overcome resistance at the very important 200-SMA. Oscillators on this chart are mixed.
On the daily chart, oscillators are also mixed, but the relative strength index is positive, supporting the bulls. If prices fail to hold the 20-day SMA, the bulls will lose control. However, if prices manage to reach the 100-day SMA, the pair will accelerate towards the January highs.
*تعینات کیا مراد ہے مارکیٹ کے تجزیات یہاں ارسال کیے جاتے ہیں جس کا مقصد آپ کی بیداری بڑھانا ہے، لیکن تجارت کرنے کے لئے ہدایات دینا نہیں.
InstaSpot analytical reviews will make you fully aware of market trends! Being an InstaSpot client, you are provided with a large number of free services for efficient trading.


