


انسٹا فاریکس ٹیم میں لیجنڈ!
لیجنڈ!آپ کو لگتا ہے کہ یہ حیرت انگیز بیانات ہے؟ لیکن ہمیں ایسے شخص کو کیا کہنا چاہئے ، جو 18 سال میں جونیئر ورلڈ شطرنج چیمپئن شپ جیتنے والا پہلا ایشین بن گیا تھا اور 19 میں پہلا ہندوستانی گرینڈ ماسٹر بنا؟ ورلڈ چیمپیئن ٹائٹل کے لئے یہ مشکل آغاز تھا جو وشونااتھ آنند کے لئے تھا ، وہ شخص جو ہمیشہ کے لئے شطرنج کی تاریخ کا حصہ بن گیا تھا۔ انسٹا فاریکس ٹیم میں اب ایک اور لیجنڈ!


Borussia is one of the most titled football clubs in Germany, which has repeatedly proved to fans: the spirit of competition and leadership will certainly lead to success. Trade in the same way that sports professionals play the game: confidently and actively. Keep a "pass" from Borussia FC and be in the lead with InstaSpot!

The wave pattern on the 4-hour chart for EUR/USD looks fairly clear, albeit quite complex. There is no talk of canceling the bullish trend that began in January 2025, but the wave structure starting from July 1 has taken on a complex and extended form. In my view, the pair has completed the formation of corrective wave 4, which developed in a very non-standard way. Within this wave, we observed exclusively corrective structures, leaving no doubt about the corrective nature of the decline.
In my opinion, the construction of the bullish trend is not finished, and its targets may extend as far as the 25th level. The series of waves a–b–c–d–e looks complete; therefore, over the coming weeks I expect the formation of a new bullish wave sequence. We have already seen the presumed waves 1 and 2, and the instrument is now in the process of forming wave 3 or c. I expected this wave to lift the instrument to the 1.1717 level, which corresponds to the 38.2% Fibonacci retracement. However, this wave is turning out to be more extended, which is a very positive sign, as it increases the chances that it will be impulsive—and, along with it, the entire bullish wave sequence.
The EUR/USD pair gained about 15 basis points on Tuesday, after rising by 50 the day before. At first glance, it may seem that the market is wide awake and certainly not about to start celebrating Christmas and the New Year ahead of time. However, in my view, nothing extraordinary has happened over the first two days of the week. The pair rose by a total of about 90 points. That is not insignificant, but the most recent high was not broken, and today's U.S. news flow managed to restrain buyers eager to push higher.
Typically, markets pay little attention to GDP reports, despite their importance—this has historically been the case. Today, however, market participants could not ignore the data, as the U.S. economy grew by 4.3% in the third quarter, which is even stronger than the "artificial" 3.8% recorded in the second quarter. As a result, Donald Trump once again "silenced" his skeptics. He promised strong economic growth, and the economy is indeed growing at a rapid pace.
Unfortunately, other U.S. reports failed to show equally positive results, so the strengthening of the U.S. dollar may be limited. Once again, we are seeing a situation in which GDP appears detached from the rest of the economic indicators. The labor market is weakening, inflation is declining (which is unfavorable for economic growth), unemployment is rising, business activity is low, industrial production is weak, and retail sales are far from impressive—yet the economy is growing at near-record rates. I believe the dollar will not extract much benefit from this GDP report.
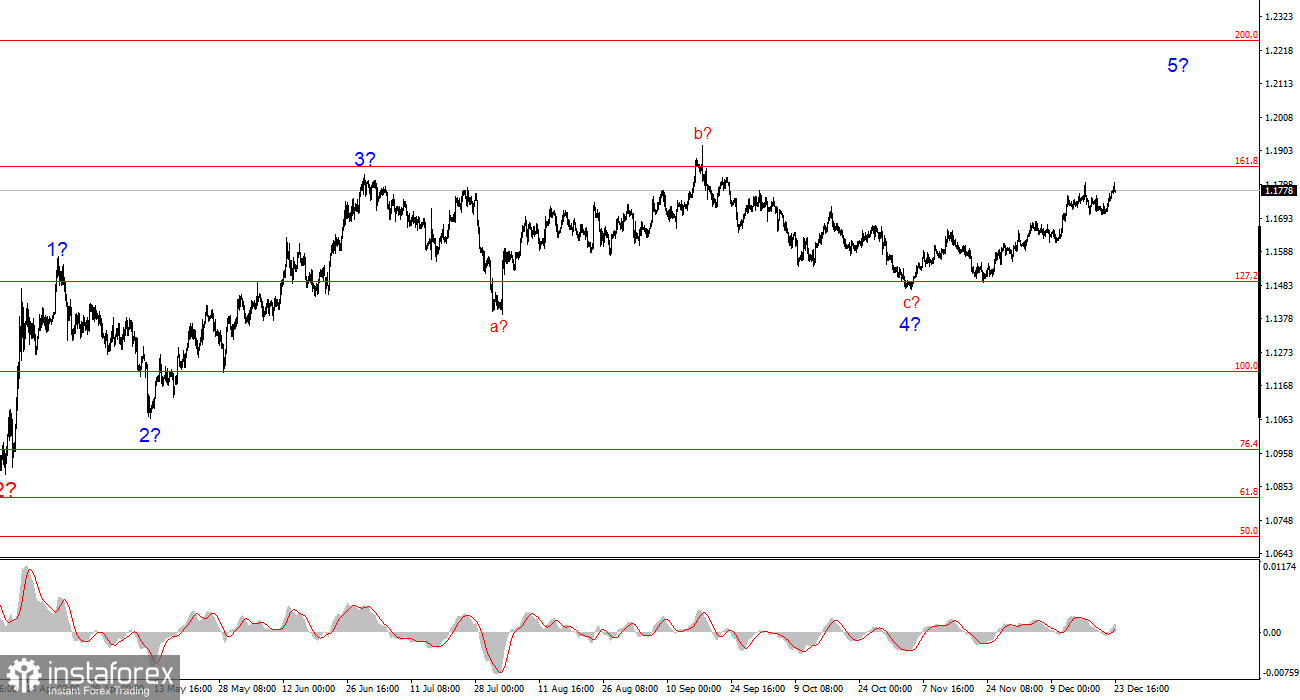
Based on this EUR/USD analysis, I conclude that the pair continues to build a bullish trend. Donald Trump's policies and the Federal Reserve's monetary policy remain significant long-term factors weighing on the U.S. dollar. The targets of the current trend phase may extend as far as the 25th level. The current upward wave sequence is beginning to gain momentum, and there is reason to believe that we are now witnessing the formation of an impulsive wave structure as part of a larger global wave 5. In this case, further growth should be expected, with targets around 1.1825 and 1.1926, corresponding to the 200.0% and 261.8% Fibonacci extensions.
On a smaller timeframe, the entire bullish trend phase is clearly visible. The wave structure is not entirely standard, as the corrective waves differ in size. For example, the larger wave 2 is smaller than the internal wave 2 within wave 3. This can happen. I would like to remind readers that it is best to focus on clear and understandable structures on charts, rather than trying to label every single wave. At present, the bullish structure raises no doubts.
Core Principles of My Analysis:
*تعینات کیا مراد ہے مارکیٹ کے تجزیات یہاں ارسال کیے جاتے ہیں جس کا مقصد آپ کی بیداری بڑھانا ہے، لیکن تجارت کرنے کے لئے ہدایات دینا نہیں.
InstaSpot analytical reviews will make you fully aware of market trends! Being an InstaSpot client, you are provided with a large number of free services for efficient trading.


