


ہمارے ٹیم میں 7000000 سے ذائد تاجران شامل ہیں
ہم تجارت کی بہتری کے لئے ہر روز اکھٹے کام کرتے ہیں اور بہترین نتائج حاصل کرتے ہوئے آگے کی جانب بڑھتے ہیں
دُنیا بھر سے سے لاکھوں ہمارے بہترین کام کو سند عطاء کرتے ہیں آپ اپنا انتحاب کریں باقی ہم آپ کی توقعات پر پورا اترنے کے لئے اپنی بہترین کوشش کریں گے
ہم مل کر ایک بہترین ٹیم بناتے ہیں
انسٹا فاریکس آپ سے کام کرتے ہوئے فخر محسوس کرتا ہے


ایکٹر - یو سی ایف 6 ٹورنامنٹ چیمپین اور واقعی ہیرو
ایک فرد کے جس نے اپنا آپ منوایا ہے وہ فرد کہ جو ہماری راہ پر چلا ہے.
ٹکٹا روو کی کامیابی کا راز یہ ہے کہ وہ اپنے اہداف کی جانب مسلسل بڑھتا رہتا ہے
اپنے ہنر یا ٹیلنٹ کے تمام پہلو آشکار کررہے ہیں
پہچانیں ، کوشش کریں ، ناکام ہوں لیکن کبھی نہ رُکیں
انسٹا فاریکس آپ کی کامیابی کی کہاں یہاں سے شروع ہوتی ہے

Trend Analysis (Fig. 1)
This week, from the 1.1745 level (the close of the last weekly candle), the market may begin moving down with a target of 1.1536 – the 38.2% retracement level (blue dashed line). Upon testing this level, the price may bounce upward toward the target of 1.1572 – the upper fractal (red dashed line).
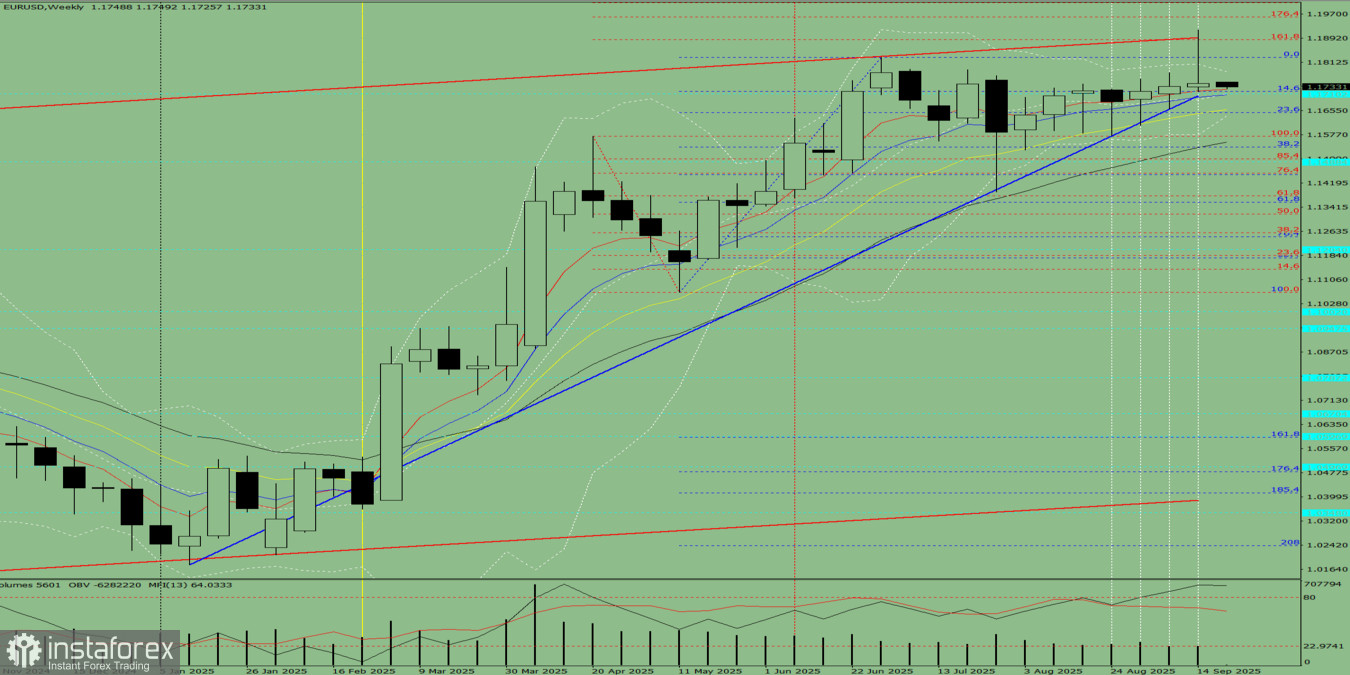
Fig. 1 (weekly chart)
Comprehensive Analysis:
Conclusion from comprehensive analysis: downward movement.
Overall candle projection for the EUR/USD pair on the weekly chart: the price is most likely to show a downward trend during the week, featuring an initial upper shadow on the weekly black (bearish) candle (Monday – upward move), and a secondary lower shadow (Friday – upward move).
Alternative Scenario: The pair may start moving downward from the 1.1745 level (close of the last weekly candle) with a target of 1.1572 – the upper fractal (red dashed line). Upon testing this level, the price may begin moving upward toward the 23.6% retracement level at 1.1647 (blue dashed line).
*تعینات کیا مراد ہے مارکیٹ کے تجزیات یہاں ارسال کیے جاتے ہیں جس کا مقصد آپ کی بیداری بڑھانا ہے، لیکن تجارت کرنے کے لئے ہدایات دینا نہیں.
InstaSpot analytical reviews will make you fully aware of market trends! Being an InstaSpot client, you are provided with a large number of free services for efficient trading.


