




ہمارے ٹیم میں 7000000 سے ذائد تاجران شامل ہیں
ہم تجارت کی بہتری کے لئے ہر روز اکھٹے کام کرتے ہیں اور بہترین نتائج حاصل کرتے ہوئے آگے کی جانب بڑھتے ہیں
دُنیا بھر سے سے لاکھوں ہمارے بہترین کام کو سند عطاء کرتے ہیں آپ اپنا انتحاب کریں باقی ہم آپ کی توقعات پر پورا اترنے کے لئے اپنی بہترین کوشش کریں گے
ہم مل کر ایک بہترین ٹیم بناتے ہیں
انسٹا فاریکس آپ سے کام کرتے ہوئے فخر محسوس کرتا ہے





ایکٹر - یو سی ایف 6 ٹورنامنٹ چیمپین اور واقعی ہیرو
ایک فرد کے جس نے اپنا آپ منوایا ہے وہ فرد کہ جو ہماری راہ پر چلا ہے.
ٹکٹا روو کی کامیابی کا راز یہ ہے کہ وہ اپنے اہداف کی جانب مسلسل بڑھتا رہتا ہے
اپنے ہنر یا ٹیلنٹ کے تمام پہلو آشکار کررہے ہیں
پہچانیں ، کوشش کریں ، ناکام ہوں لیکن کبھی نہ رُکیں
انسٹا فاریکس آپ کی کامیابی کی کہاں یہاں سے شروع ہوتی ہے

The daily chart for Bitcoin (#Bitcoin, Daily) reveals clear dominance by buying pressure. The price is moving along an upward trajectory, governed by a structured technical framework defined by monthly pivot levels and the angles of intersecting price channels.
First: Deconstructing the Chart's Technical Structure
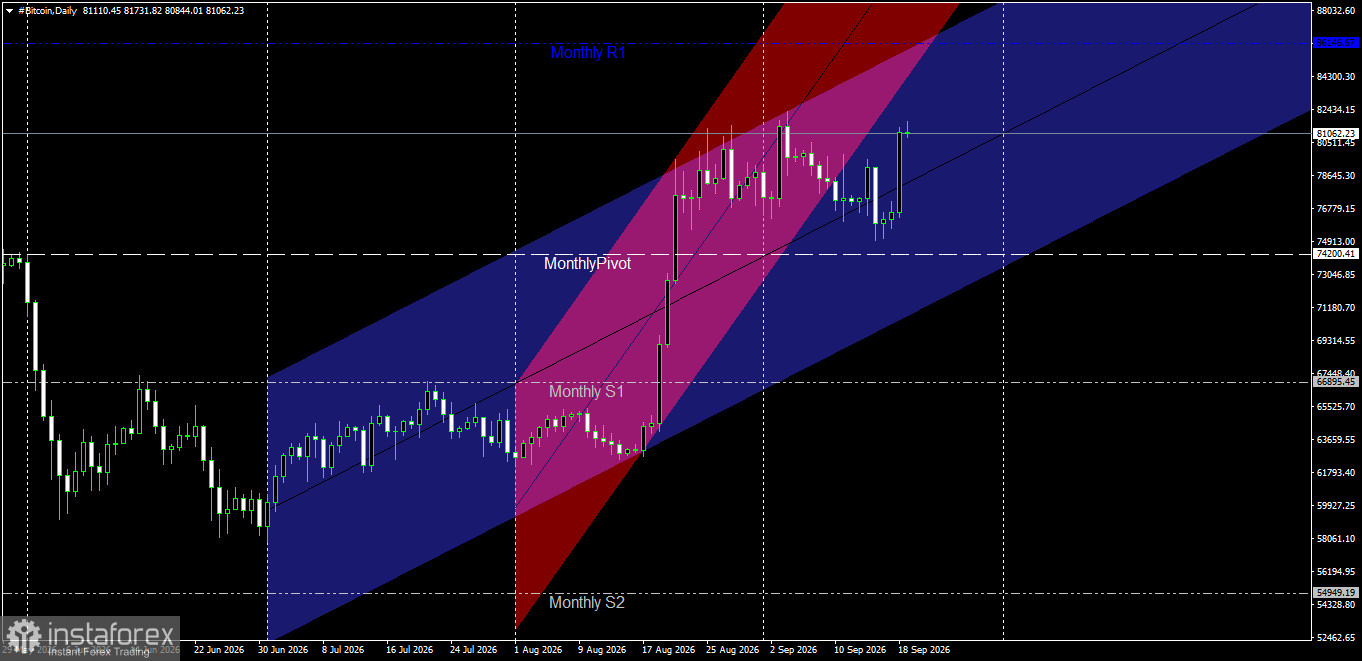
Price Behavior and Current Range: The price is trading steadily near the $81,062.23 level, establishing a series of higher highs and higher lows. This reflects sustained buyer confidence and the resilience of the overall trend that began with the rally in late June.
Key Support Zones:
Monthly Pivot Point: Located at $74,200.41, this serves as the primary defensive anchor for the current trend; remaining above this level grants the bulls a significant technical advantage.
Extended Support Levels: In the event of a corrective move, the first support level (S1) at $66,895.45 and the second level (S2) at $54,328.80 act as a robust buffer against a reversal of the primary trend.
Target Resistance Hurdles:
The immediate key resistance—aligned with the upper boundary of the bullish wave (Monthly R1)—is situated at the $86,146.67 level. II. Price Forecasts and Upcoming Movement Scenarios
Bullish Expansion Scenario (Most Likely):
As long as the price maintains trading above the nearby minor low and holds steady above the $78,645–$80,500 range, the probable path is a continued advance toward the monthly resistance level at $86,146.67. Successfully breaching this barrier would open the way to test the extended peak at $88,032.60, serving as an extension target for the technical channel.
Correction and Retest Scenario:
In the event of temporary profit-taking, the price could pull back toward re-accumulation zones near $74,200.41 (Monthly Pivot). This area represents an ideal opportunity for buying forces to regroup, provided the level is not broken with two consecutive daily closes below it.
Technical Analysis Summary
All available technical data on the chart indicates that the overall trend remains positive and supported by solid anchor levels. A bullish outlook prevails as long as the price trades above the $74,200 level, with a target of $86,146 in the upcoming sessions.
The Bitcoin chart on the 4-hour timeframe (BTC/USD, H4) reflects a positive structural shift in price action; buyers have successfully concluded the bearish corrective wave and initiated a strong upward move, resulting in a decisive breakout from the descending channel and key local levels.
First: Analysis of Structural Data and Technical Levels – Price Action and Current Trading:
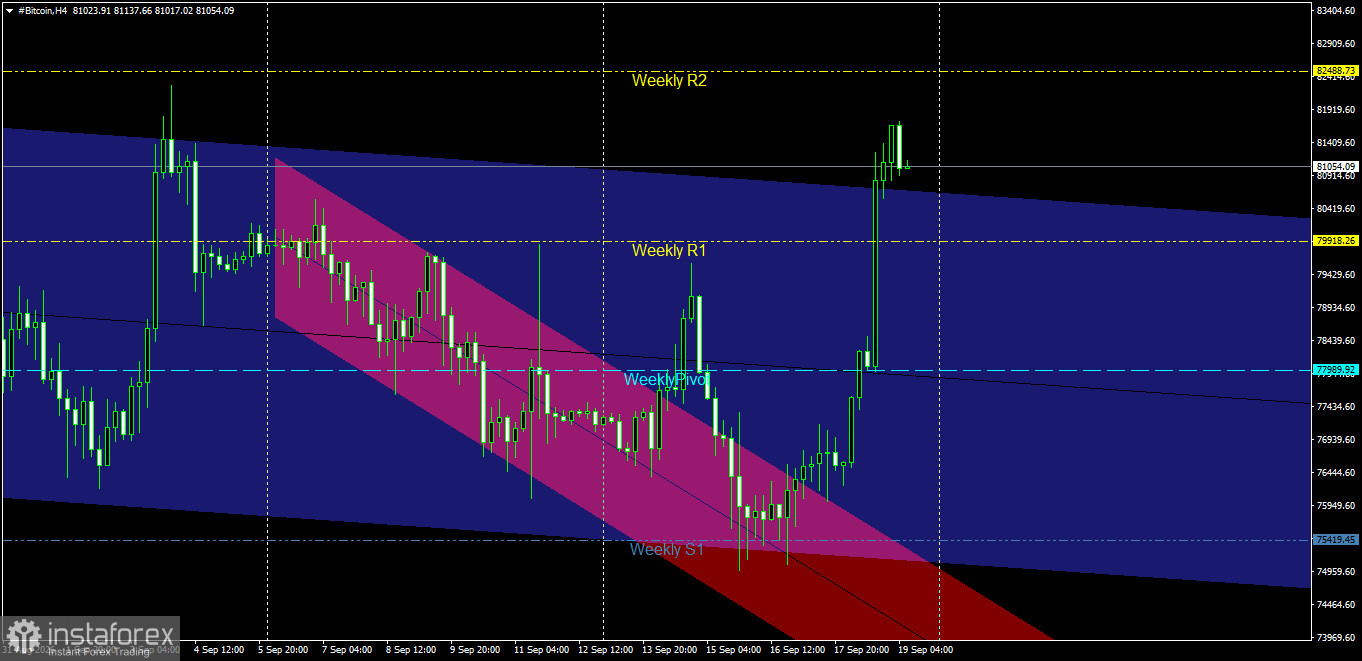
The price is currently trading around the $81,054.09 level following a sharp, rapid ascent in recent sessions, extending above the upper boundary of the red corrective channel that had previously exerted downward pressure.
**Descending Channel Breakout:** The price has successfully broken out and fully exited the minor descending channel range (marked in red and pink); this serves as a strong technical signal that the corrective phase has ended and buying momentum has regained control.
**Weekly Pivot Levels:**
**Weekly Pivot:** Located at $77,989.92; this level was successfully breached after previously serving as a critical battleground between bulls and bears.
**Weekly Resistance 1 (Weekly R1):** Located at $79,918.26; following the breakout, this level has now shifted into a nearby support level that helps sustain the upward trend.
**Weekly Resistance 2 (Weekly R2):** Represents the immediate upper target, situated at $82,488.73.
**Key Support Levels:**
The price is supported by the Weekly S1 level at $75,419.45, which marked the low point that ignited the recent surge in buying activity. Second: Expected Price Movement Scenarios – Bullish Scenario (Most Likely):
The price is exhibiting strong upward momentum; as long as it trades above the broken resistance level of $79,918.26 (Weekly R1), the bullish trend remains dominant.
Bitcoin's immediate target is to test the second weekly resistance (Weekly R2) at $82,488.73.
If the price manages to break through and stabilize above this level—confirmed by a strong four-hour candle—it would pave the way for targeting higher levels around $83,404 and surpassing the previous peak.
Corrective Scenario (Alternative):
Should the price experience rapid profit-taking, it is expected to decline to retest the breakout zone situated between $79,918.26 and $77,989.92 (Weekly Pivot).
This zone represents an ideal range for renewed buying accumulation; the bullish outlook remains valid unless the price settles below the $77,989 level.
Recommendation and Final Technical Outlook:
The chart structure on the four-hour timeframe indicates clear bullish dominance following the successful breakout from the descending channel and the recovery of the weekly Pivot levels. It is advisable to monitor price action near the $82,488 level to gauge whether the price will continue its upward trajectory or initiate a new consolidation phase.
*تعینات کیا مراد ہے مارکیٹ کے تجزیات یہاں ارسال کیے جاتے ہیں جس کا مقصد آپ کی بیداری بڑھانا ہے، لیکن تجارت کرنے کے لئے ہدایات دینا نہیں.
InstaSpot analytical reviews will make you fully aware of market trends! Being an InstaSpot client, you are provided with a large number of free services for efficient trading.


