




ہمارے ٹیم میں 7000000 سے ذائد تاجران شامل ہیں
ہم تجارت کی بہتری کے لئے ہر روز اکھٹے کام کرتے ہیں اور بہترین نتائج حاصل کرتے ہوئے آگے کی جانب بڑھتے ہیں
دُنیا بھر سے سے لاکھوں ہمارے بہترین کام کو سند عطاء کرتے ہیں آپ اپنا انتحاب کریں باقی ہم آپ کی توقعات پر پورا اترنے کے لئے اپنی بہترین کوشش کریں گے
ہم مل کر ایک بہترین ٹیم بناتے ہیں
انسٹا فاریکس آپ سے کام کرتے ہوئے فخر محسوس کرتا ہے





ایکٹر - یو سی ایف 6 ٹورنامنٹ چیمپین اور واقعی ہیرو
ایک فرد کے جس نے اپنا آپ منوایا ہے وہ فرد کہ جو ہماری راہ پر چلا ہے.
ٹکٹا روو کی کامیابی کا راز یہ ہے کہ وہ اپنے اہداف کی جانب مسلسل بڑھتا رہتا ہے
اپنے ہنر یا ٹیلنٹ کے تمام پہلو آشکار کررہے ہیں
پہچانیں ، کوشش کریں ، ناکام ہوں لیکن کبھی نہ رُکیں
انسٹا فاریکس آپ کی کامیابی کی کہاں یہاں سے شروع ہوتی ہے

The 1-hour (H1) chart for Crude Oil reveals pivotal price movements reflecting a tug-of-war between buying and selling forces; the price is currently trading near the $102.21 level after successfully breaking free from recent bearish pressure.
Technical Reading and Price Action
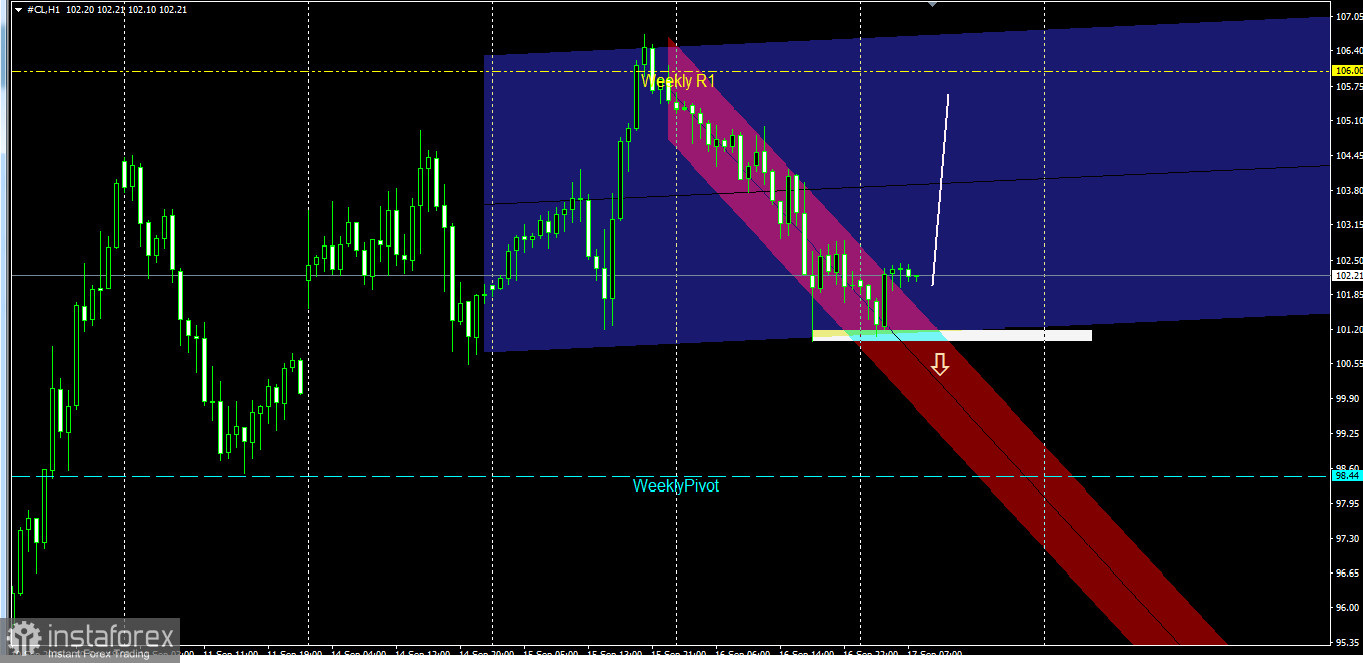
Price Channel Structure: Today's session opened within the range of two overlapping channels: the blue channel (horizontal/sideways), representing price movement over the past two days, and the red channel (bearish), representing the corrective downward wave of the previous session.
Rebound from the Lower Support Line: Early hours saw a test of the blue channel's lower boundary, from which the price rebounded strongly—bolstered by clear buying support—thereby halting the decline.
Breakout from the Bearish Channel: The price managed to break above the upper boundary of the red bearish channel and stabilize within the blue channel's range, reinforcing expectations of a shift toward bullish momentum.
Trading Recommendations and Expected Scenarios
Based on current chart data, there are two primary outlooks for oil's movement in the coming hours:
Bullish Scenario (Primary): Establishing a base above the broken red channel and stabilizing above $101.85 Targeting $106.00 (the upper boundary of the blue channel and the Weekly R1 resistance level) This scenario is invalidated if the blue channel is breached and the price drops below $101.20. Bearish Scenario (Alternative): A break below the lower boundary of the blue channel and the $101.20 support level, targeting $98.44 (Weekly Pivot level). This scenario is invalidated if trading resumes above the $102.50 level.
Trading Plan and Risk Management
Buy Setup: A favorable buying opportunity exists at current levels (102.00 – 102.30) or upon a minor retest of the 101.85 area, targeting 104.45 followed by 106.00.
Risk Management: It is recommended to place a stop-loss order below the recent pivotal low and the support level at $101.10, while maintaining a balanced risk ratio to preserve capital.
The daily chart for crude oil (#CL, Daily) shows a clear continuation of strong bullish momentum; the price is currently trading near the $101.81 level following a rebound and a recent test of the lower boundary of the inner ascending channel, reinforcing the dominance of buying pressure on price action.
Technical Analysis and Price Action
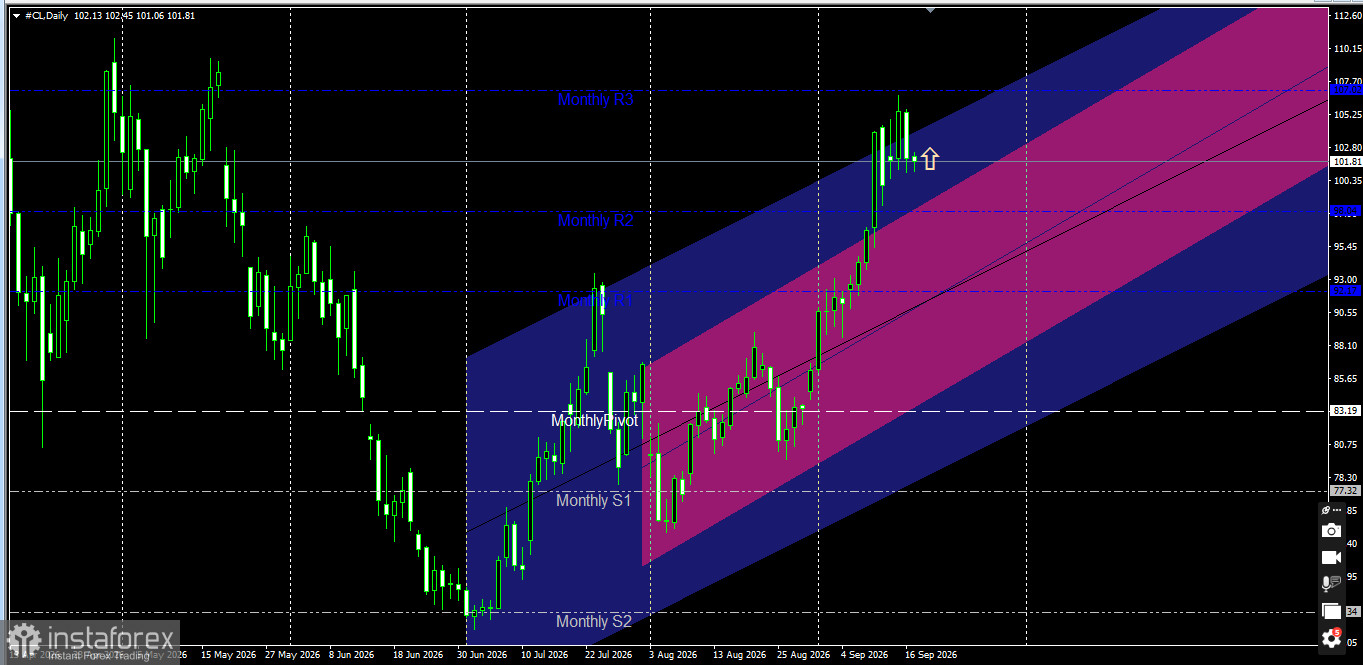
General Trend and Price Channels: The price is clearly moving within a primary ascending price channel (blue) and a narrower, steeper channel (pink) that reflects the movement's positive acceleration. The price previously managed to break above the second monthly resistance level (Monthly R2) at $98.04, which has now transformed into a strong, pivotal support level.
Interaction with Resistance and Pivot Levels: During its latest upward wave, the price approached the third monthly resistance level (Monthly R3)—spanning the $107.02–$107.70 range—before undergoing a corrective retest that successfully stabilized above the lower boundary of the pink channel.
Key Support Levels:
First Support: $100.35–$98.04 (including the previously broken Monthly R2 resistance level).
Pivotal Support: Monthly Pivot level at $83.19.
Key Resistance Levels:
First Resistance: $105.25 (upper boundary of the pink channel).
Main Resistance: $107.02–$107.70 (Monthly R3). Price Action Outlook and Trading Recommendations
1. Bullish Scenario (Primary):
The bullish scenario is the most likely outcome, given that the price remains stable within the pink channel and above the $98.04 support level.
Entry Point: Buy at current levels ($101.50 – $102.00) or upon a minor retest of the $100.35 area.
Technical Targets: Target the $105.25 level first, followed by a move toward the third monthly resistance zone at $107.02.
Stop Loss: A daily candle close below the $98.00 level.
2. Bearish Scenario (Alternative):
This scenario is triggered only if the price deviates from its current upward trajectory and breaks out of the immediate pink channel.
Validation Condition: A break below the $98.04 support level, confirmed by a full daily candle closing below it.
Technical Targets: In this case, the price would move into a deeper corrective phase, targeting the $92.17 level (Monthly R1) followed by the blue channel midline near $88.10.
*تعینات کیا مراد ہے مارکیٹ کے تجزیات یہاں ارسال کیے جاتے ہیں جس کا مقصد آپ کی بیداری بڑھانا ہے، لیکن تجارت کرنے کے لئے ہدایات دینا نہیں.
InstaSpot analytical reviews will make you fully aware of market trends! Being an InstaSpot client, you are provided with a large number of free services for efficient trading.


