




ہمارے ٹیم میں 7000000 سے ذائد تاجران شامل ہیں
ہم تجارت کی بہتری کے لئے ہر روز اکھٹے کام کرتے ہیں اور بہترین نتائج حاصل کرتے ہوئے آگے کی جانب بڑھتے ہیں
دُنیا بھر سے سے لاکھوں ہمارے بہترین کام کو سند عطاء کرتے ہیں آپ اپنا انتحاب کریں باقی ہم آپ کی توقعات پر پورا اترنے کے لئے اپنی بہترین کوشش کریں گے
ہم مل کر ایک بہترین ٹیم بناتے ہیں
انسٹا فاریکس آپ سے کام کرتے ہوئے فخر محسوس کرتا ہے





ایکٹر - یو سی ایف 6 ٹورنامنٹ چیمپین اور واقعی ہیرو
ایک فرد کے جس نے اپنا آپ منوایا ہے وہ فرد کہ جو ہماری راہ پر چلا ہے.
ٹکٹا روو کی کامیابی کا راز یہ ہے کہ وہ اپنے اہداف کی جانب مسلسل بڑھتا رہتا ہے
اپنے ہنر یا ٹیلنٹ کے تمام پہلو آشکار کررہے ہیں
پہچانیں ، کوشش کریں ، ناکام ہوں لیکن کبھی نہ رُکیں
انسٹا فاریکس آپ کی کامیابی کی کہاں یہاں سے شروع ہوتی ہے

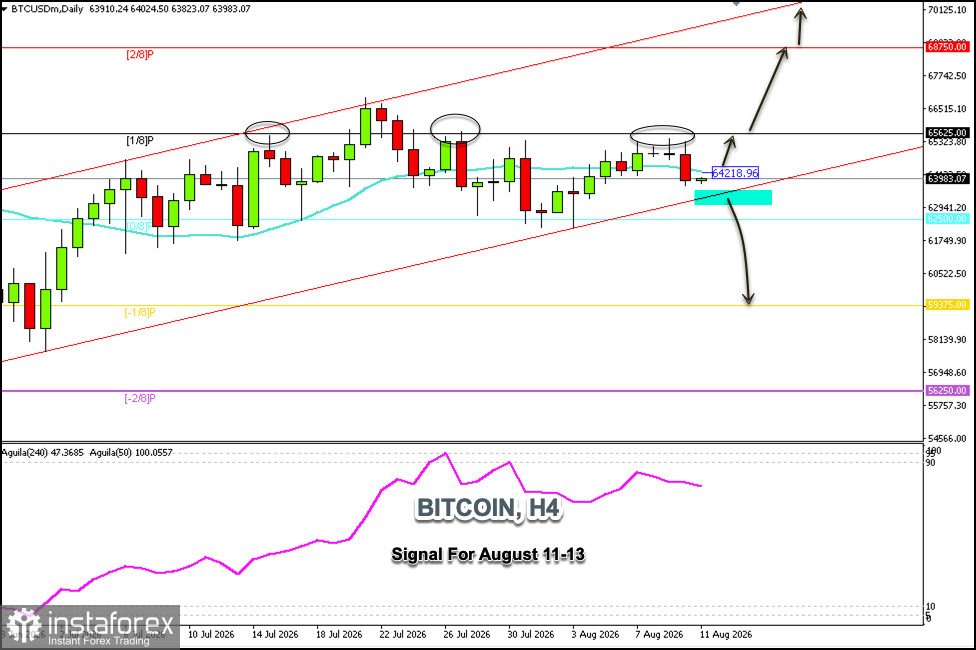
Bitcoin is trading around $63,983, below the 21-day SMA and within an uptrend channel that has been forming since early July. On the daily chart, we can see that Bitcoin is struggling to break above the $65,625 zone, as it has been attempting to do so over the past week but has been unsuccessful.
Today's daily chart shows a decline in Bitcoin, and there could be a sharp downward acceleration if there is a decisive break below the uptrend channel. If this occurs, we could expect it to reach $62,500 and potentially even hit the psychological level of $60,000.
Conversely, if Bitcoin consolidates above $64,218 in the coming hours, we could expect a recovery, and there could be strong momentum to push above $65,600, as this level acts as a key support for BTC.
If Bitcoin quickly surpasses $65,625 in the coming days, it could reach the 2/8 Murray level around $68,750 and might even hit the psychological level of $70,000, which would coincide with the upper band of the uptrend channel.
We should monitor Bitcoin's price movement closely in the coming hours; a drop below $63,000 could change Bitcoin's outlook and potentially trigger a bearish cycle, while a move above $65,000 could signal a further uptrend.
*تعینات کیا مراد ہے مارکیٹ کے تجزیات یہاں ارسال کیے جاتے ہیں جس کا مقصد آپ کی بیداری بڑھانا ہے، لیکن تجارت کرنے کے لئے ہدایات دینا نہیں.
InstaSpot analytical reviews will make you fully aware of market trends! Being an InstaSpot client, you are provided with a large number of free services for efficient trading.


