


ہمارے ٹیم میں 7000000 سے ذائد تاجران شامل ہیں
ہم تجارت کی بہتری کے لئے ہر روز اکھٹے کام کرتے ہیں اور بہترین نتائج حاصل کرتے ہوئے آگے کی جانب بڑھتے ہیں
دُنیا بھر سے سے لاکھوں ہمارے بہترین کام کو سند عطاء کرتے ہیں آپ اپنا انتحاب کریں باقی ہم آپ کی توقعات پر پورا اترنے کے لئے اپنی بہترین کوشش کریں گے
ہم مل کر ایک بہترین ٹیم بناتے ہیں
انسٹا فاریکس آپ سے کام کرتے ہوئے فخر محسوس کرتا ہے


ایکٹر - یو سی ایف 6 ٹورنامنٹ چیمپین اور واقعی ہیرو
ایک فرد کے جس نے اپنا آپ منوایا ہے وہ فرد کہ جو ہماری راہ پر چلا ہے.
ٹکٹا روو کی کامیابی کا راز یہ ہے کہ وہ اپنے اہداف کی جانب مسلسل بڑھتا رہتا ہے
اپنے ہنر یا ٹیلنٹ کے تمام پہلو آشکار کررہے ہیں
پہچانیں ، کوشش کریں ، ناکام ہوں لیکن کبھی نہ رُکیں
انسٹا فاریکس آپ کی کامیابی کی کہاں یہاں سے شروع ہوتی ہے

Yesterday, the euro zone's ZEW economic sentiment indicators for April were disappointing. The index plunged from 39.8 in March to -18.5, far below the forecast of 13.2. We believe the European business community is taking a more realistic view of the trade war's consequences than the media suggests and is also skeptical about the "off-budget" plan to ramp up defense production. We previously stated that the U.S. will likely be the trade war's main beneficiary. As a result, we view the entire April rise in the euro as speculative and expect a decline once the right catalyst appears.
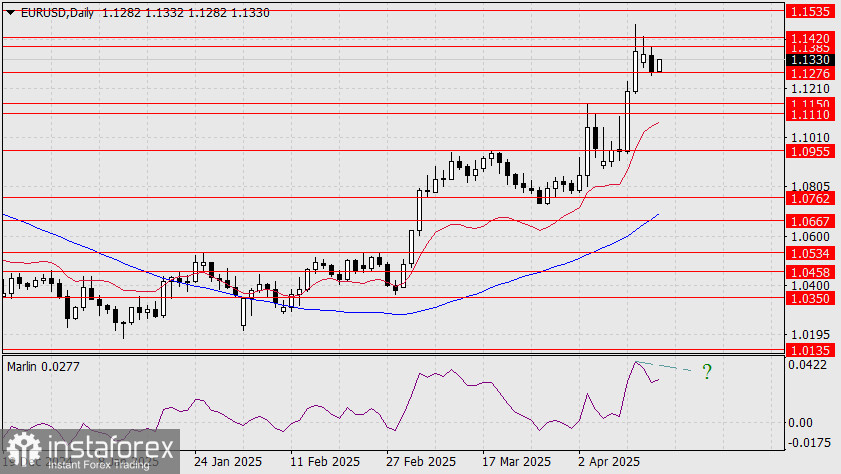
The first such catalyst could be tomorrow's European Central Bank monetary policy meeting. We anticipate a more decisive stance from the central bank in supporting the economy and responding to slowing inflation. Today's forecast for March CPI is 2.2% y/y versus 2.3% in February. Core CPI is expected to ease from 2.6% y/y to 2.4% y/y.
The ideal euro reversal point is the 1.1535 target. If volatility increases on the day of the ECB meeting, this level could be reached, possibly forming a bearish divergence on the daily chart. If there is no upward price spike, a move below the support range at 1.1110/50 would signal a reversal.
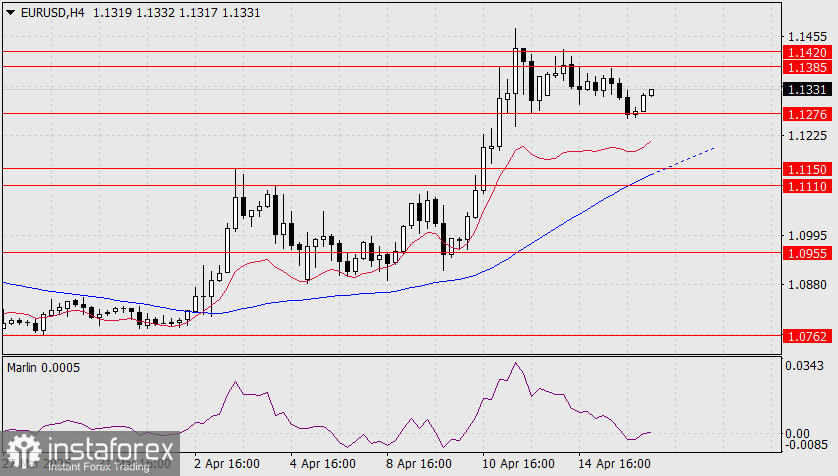
The price is rebounding from the 1.1276 support level on the four-hour chart. The Marlin oscillator is breaking into the positive trend territory, indicating that the upward trend is still intact.
Also on this timeframe, the Kijun (MACD) line has moved into the 1.1110/50 support zone, reinforcing its importance as a potential medium-term reversal area.
*تعینات کیا مراد ہے مارکیٹ کے تجزیات یہاں ارسال کیے جاتے ہیں جس کا مقصد آپ کی بیداری بڑھانا ہے، لیکن تجارت کرنے کے لئے ہدایات دینا نہیں.
InstaSpot analytical reviews will make you fully aware of market trends! Being an InstaSpot client, you are provided with a large number of free services for efficient trading.


