


ہمارے ٹیم میں 7000000 سے ذائد تاجران شامل ہیں
ہم تجارت کی بہتری کے لئے ہر روز اکھٹے کام کرتے ہیں اور بہترین نتائج حاصل کرتے ہوئے آگے کی جانب بڑھتے ہیں
دُنیا بھر سے سے لاکھوں ہمارے بہترین کام کو سند عطاء کرتے ہیں آپ اپنا انتحاب کریں باقی ہم آپ کی توقعات پر پورا اترنے کے لئے اپنی بہترین کوشش کریں گے
ہم مل کر ایک بہترین ٹیم بناتے ہیں
انسٹا فاریکس آپ سے کام کرتے ہوئے فخر محسوس کرتا ہے


ایکٹر - یو سی ایف 6 ٹورنامنٹ چیمپین اور واقعی ہیرو
ایک فرد کے جس نے اپنا آپ منوایا ہے وہ فرد کہ جو ہماری راہ پر چلا ہے.
ٹکٹا روو کی کامیابی کا راز یہ ہے کہ وہ اپنے اہداف کی جانب مسلسل بڑھتا رہتا ہے
اپنے ہنر یا ٹیلنٹ کے تمام پہلو آشکار کررہے ہیں
پہچانیں ، کوشش کریں ، ناکام ہوں لیکن کبھی نہ رُکیں
انسٹا فاریکس آپ کی کامیابی کی کہاں یہاں سے شروع ہوتی ہے

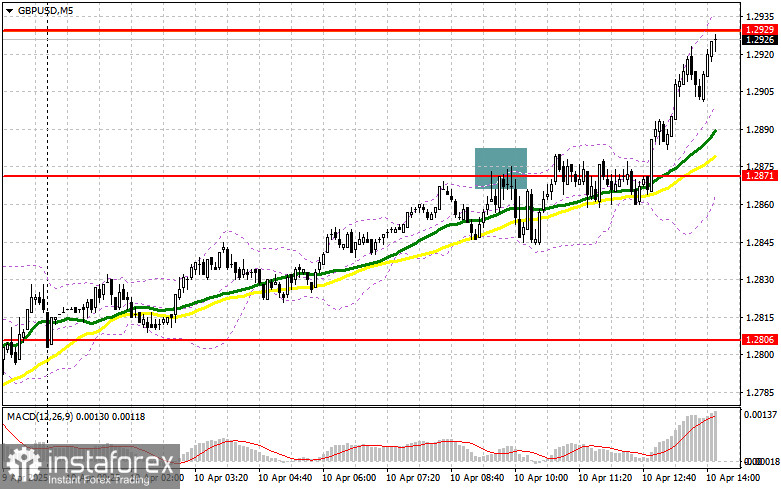
To open long positions on GBP/USD:
The pound continued to recover even without important fundamental statistics from the UK. Comments from Bank of England officials did not put significant pressure on the pound, as markets remained in euphoria over the lifting of U.S. trade tariffs. However, in the second half of the day, pressure on the pair may return, as important U.S. Consumer Price Index (CPI) data for March is expected, along with several speeches from Federal Reserve representatives. Special attention should be paid to remarks from FOMC member Michelle Bowman. A hawkish stance on interest rates could trigger a GBP/USD correction — which I plan to use.
If the pair declines, I prefer to act around the 1.2866 support formed earlier today. A false breakout there would be a good entry point for long positions, targeting a recovery to the 1.2929 resistance level, which is currently being tested. A breakout and a downward retest of this range would lead to a new entry point for long positions, with the potential to revisit 1.2986 — a significant correction. The furthest target will be the 1.3047 level, where I plan to take profits. A test of this level would mark the end of the bearish market development.
If GBP/USD declines and there is no buyer activity near 1.2866, pressure on the pair will increase. In that case, only a false breakout around 1.2806 would be a valid condition for opening long positions. I plan to buy GBP/USD on a rebound from the 1.2744 support level, targeting an intraday correction of 30–35 points.
To open short positions on GBP/USD:
Sellers tried to make their presence known, but the positive news backdrop following the U.S. tariff removal did its job. If GBP/USD rises during the U.S. session following Fed comments and news of lower U.S. inflation, a false breakout around 1.2929 would provide a short entry point, targeting a drop to the new 1.2866 support level. A breakout and retest from below would trigger stop-loss orders, opening the way to 1.2806, where moving averages — currently supporting the bulls — are located. The furthest target will be the 1.2744 level, where I plan to take profits.
If demand for the pound persists this afternoon and bears do not act near 1.2929, it's best to postpone shorts until a test of the 1.2986 resistance. I'll open short positions there only on a false breakout. If there's no downward movement even there, I'll look for short entries around 1.3047 — but only with the aim of a 30–35 point intraday correction.
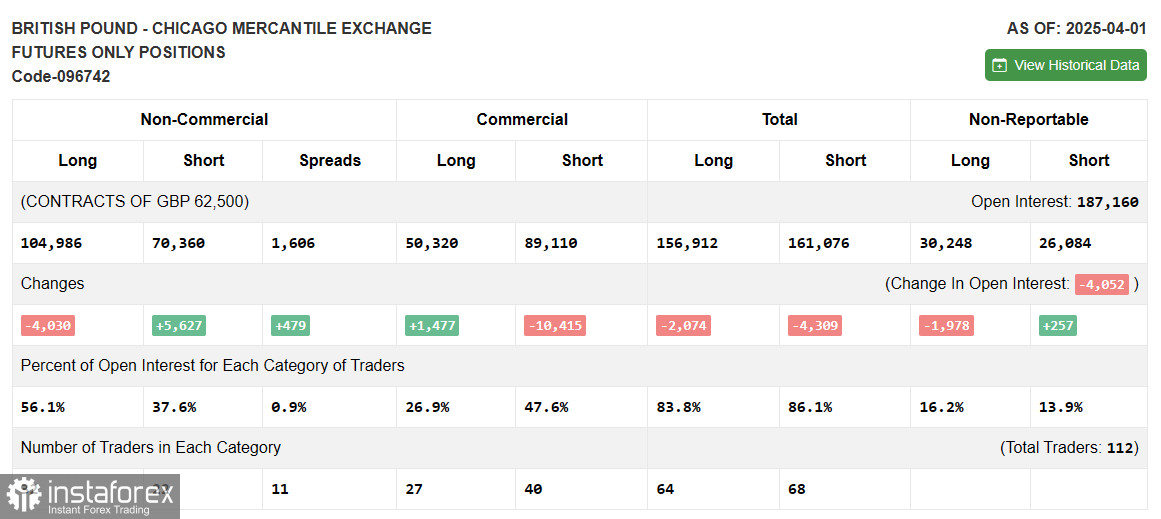
COT (Commitment of Traders) Report – April 1:
There was a slight increase in short positions and a decrease in long positions. It's important to note that this report does not reflect the recent U.S. trade tariffs introduced against major economic partners — including the UK — nor the latest U.S. March employment data. Therefore, a deep analysis of these figures is not advisable, as they no longer reflect the current situation. The latest COT report showed long non-commercial positions dropped by 4,030 to 104,986, while short non-commercial positions increased by 5,627 to 64,733. As a result, the gap between long and short positions widened by 479.
Indicator signals:
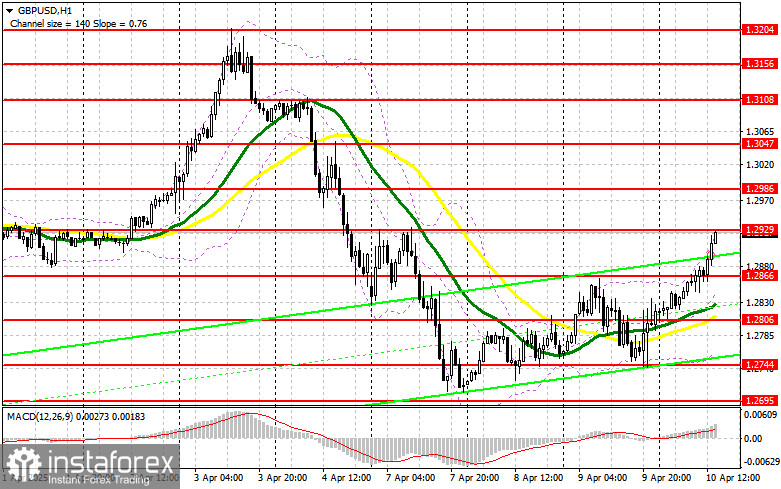
Moving Averages Trading is taking place above the 30- and 50-period moving averages, indicating that the pair's correction is continuing.
Note: The periods and prices of moving averages referenced are based on the author's hourly chart (H1) and differ from classic daily moving averages on the D1 chart.
Bollinger Bands In case of a decline, the lower boundary of the indicator around 1.2750 will serve as support.
Indicator descriptions:
*تعینات کیا مراد ہے مارکیٹ کے تجزیات یہاں ارسال کیے جاتے ہیں جس کا مقصد آپ کی بیداری بڑھانا ہے، لیکن تجارت کرنے کے لئے ہدایات دینا نہیں.
InstaSpot analytical reviews will make you fully aware of market trends! Being an InstaSpot client, you are provided with a large number of free services for efficient trading.


