


انسٹا فاریکس ٹیم میں لیجنڈ!
لیجنڈ!آپ کو لگتا ہے کہ یہ حیرت انگیز بیانات ہے؟ لیکن ہمیں ایسے شخص کو کیا کہنا چاہئے ، جو 18 سال میں جونیئر ورلڈ شطرنج چیمپئن شپ جیتنے والا پہلا ایشین بن گیا تھا اور 19 میں پہلا ہندوستانی گرینڈ ماسٹر بنا؟ ورلڈ چیمپیئن ٹائٹل کے لئے یہ مشکل آغاز تھا جو وشونااتھ آنند کے لئے تھا ، وہ شخص جو ہمیشہ کے لئے شطرنج کی تاریخ کا حصہ بن گیا تھا۔ انسٹا فاریکس ٹیم میں اب ایک اور لیجنڈ!


Borussia is one of the most titled football clubs in Germany, which has repeatedly proved to fans: the spirit of competition and leadership will certainly lead to success. Trade in the same way that sports professionals play the game: confidently and actively. Keep a "pass" from Borussia FC and be in the lead with InstaSpot!

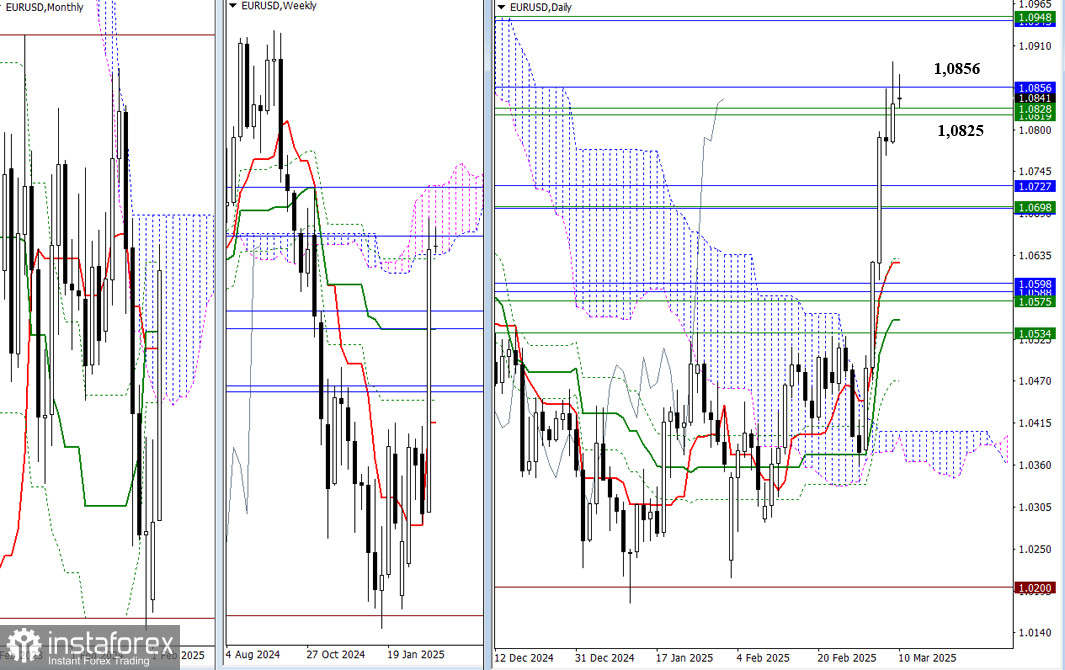
Last week, the EUR/USD pair closed within the weekly cloud, with the lower boundary at 1.0825. It reached the final level of the monthly Ichimoku cross at 1.0856. If the pair successfully overcomes these resistance levels, it will pave the way to the upper boundaries of the Ichimoku cloud at the monthly level (1.0943) and the weekly level (1.0948). Conversely, a rebound from the tested range of 1.0825 to 1.0856 could push the pair back toward previous clusters of resistance around 1.0727 to 1.0696, which align with the weekly medium-term trend as well as the monthly Tenkan and Kijun lines.
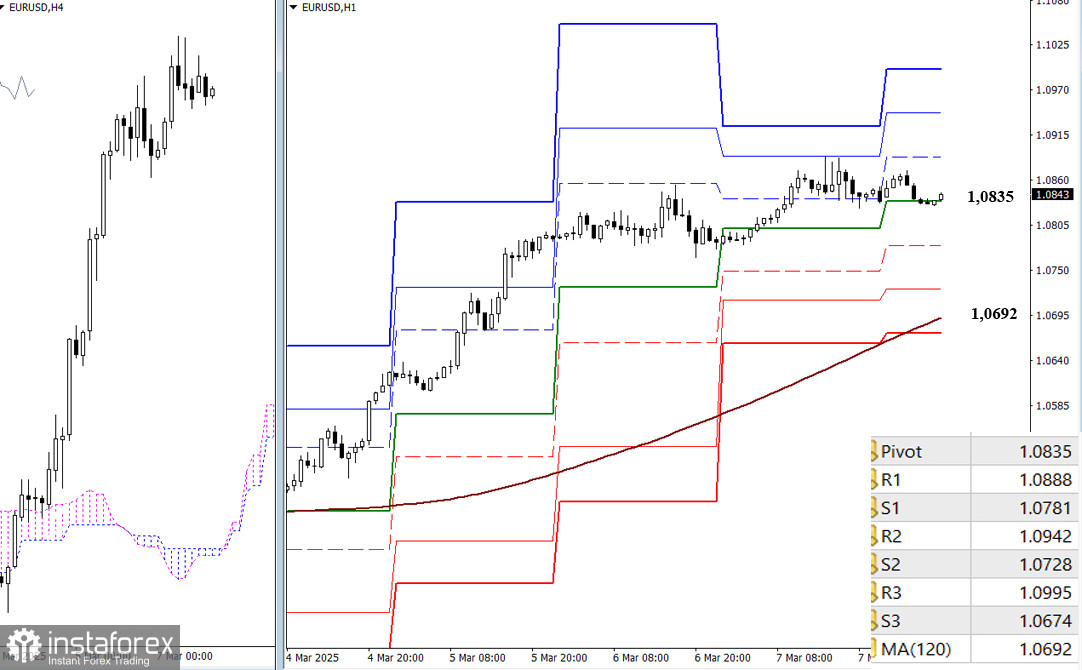
On lower timeframes, buyers currently hold the advantage. To maintain the upward movement, they need to break through the resistance at the classic Pivot levels for the day, which are positioned at 1.0888, 1.0942, and 1.0995. If the upward momentum fails, sellers may test the support levels at the classic Pivot points (1.0781 to 1.0728) before reaching the weekly long-term trend at 1.0692. This trend is crucial in determining the current balance of power, so a breakout and reversal below this level would enable sellers to plan for a longer-term downward move.
***
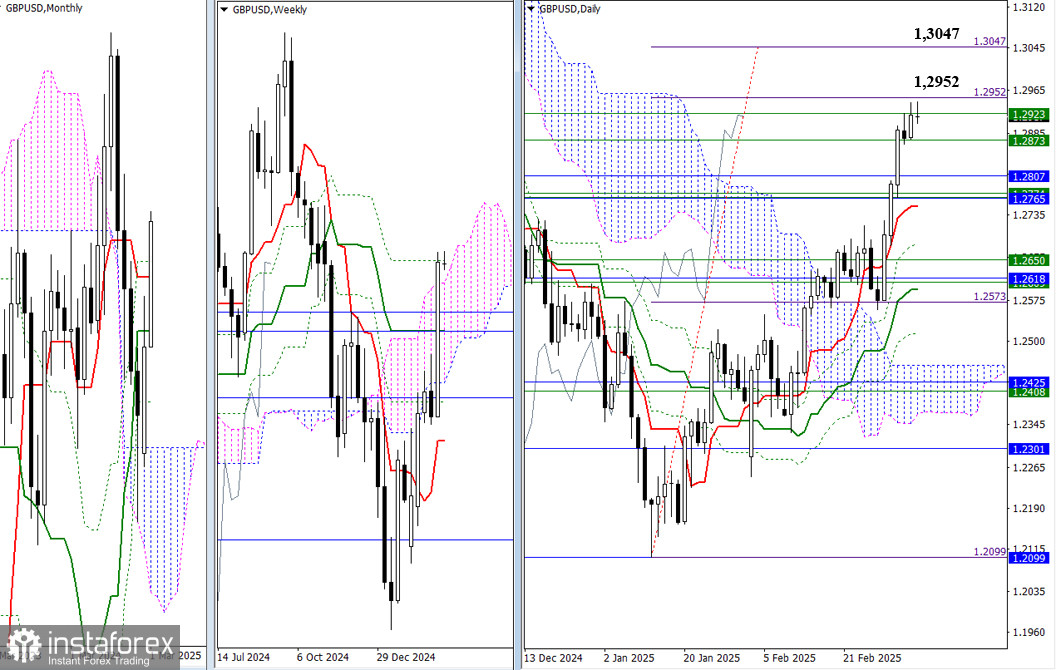
Buyers are currently facing a significant resistance zone. Although several levels have been surpassed, the target for a breakout, represented by the daily Ichimoku cloud (ranging from 1.2952 to 1.3047), remains a hurdle. A successful breakout and consolidation above this zone could lead to new bullish targets, including a potential rise to the nearest high at 1.3433. However, if buyers fail at this point, bearish activity could revert to the previously established support zone (between 1.2873 and 1.2751).
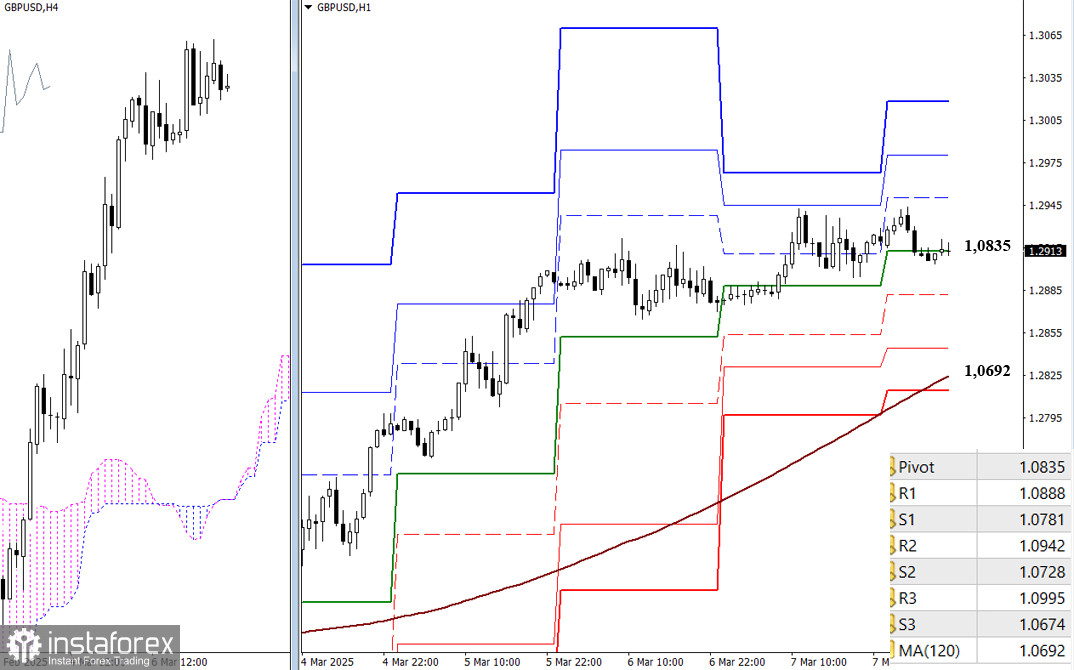
On lower timeframes, buyers are in a more favorable position. Key reference points for maintaining upward momentum throughout the day are located at the classic Pivot levels of 1.2950, 1.2981, and 1.3018. If a corrective decline occurs, the pair may find support at the classic Pivot levels (ranging from 1.2882 to 1.2845), followed by a longer-term weekly trend line at 1.0692. A breakout below this trend could shift the balance of power in favor of sellers.
***
*تعینات کیا مراد ہے مارکیٹ کے تجزیات یہاں ارسال کیے جاتے ہیں جس کا مقصد آپ کی بیداری بڑھانا ہے، لیکن تجارت کرنے کے لئے ہدایات دینا نہیں.
InstaSpot analytical reviews will make you fully aware of market trends! Being an InstaSpot client, you are provided with a large number of free services for efficient trading.


