


انسٹا فاریکس ٹیم میں لیجنڈ!
لیجنڈ!آپ کو لگتا ہے کہ یہ حیرت انگیز بیانات ہے؟ لیکن ہمیں ایسے شخص کو کیا کہنا چاہئے ، جو 18 سال میں جونیئر ورلڈ شطرنج چیمپئن شپ جیتنے والا پہلا ایشین بن گیا تھا اور 19 میں پہلا ہندوستانی گرینڈ ماسٹر بنا؟ ورلڈ چیمپیئن ٹائٹل کے لئے یہ مشکل آغاز تھا جو وشونااتھ آنند کے لئے تھا ، وہ شخص جو ہمیشہ کے لئے شطرنج کی تاریخ کا حصہ بن گیا تھا۔ انسٹا فاریکس ٹیم میں اب ایک اور لیجنڈ!


Borussia is one of the most titled football clubs in Germany, which has repeatedly proved to fans: the spirit of competition and leadership will certainly lead to success. Trade in the same way that sports professionals play the game: confidently and actively. Keep a "pass" from Borussia FC and be in the lead with InstaSpot!

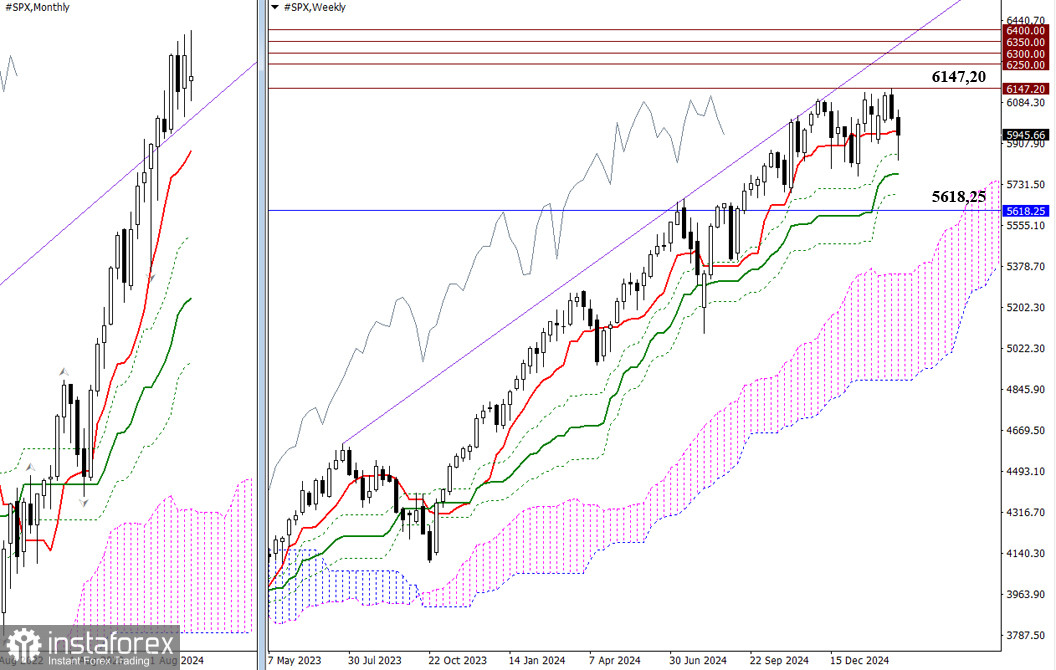
The past session marked not only the end of the trading week but also the month. February set a new high at 6,147.20 but failed to achieve more significant bullish gains. The final February candle signals uncertainty, creating conditions for a continued monthly downward correction. The nearest target on the monthly timeframe is the short-term trend, currently at 5,618.25. On the way to this level, the bears must test the support levels of the weekly Ichimoku golden cross at 5,774.49 – 5,686.52. A breakdown of the monthly short-term trend at 5,618.25 would invalidate the weekly golden cross, opening new downside opportunities for the bears.
If the bulls manage to hold their ground, an update to the current high at 6,147.20 would shift the focus toward psychological resistance levels at 6,250 – 6,300 – 6,350 – 6,400.
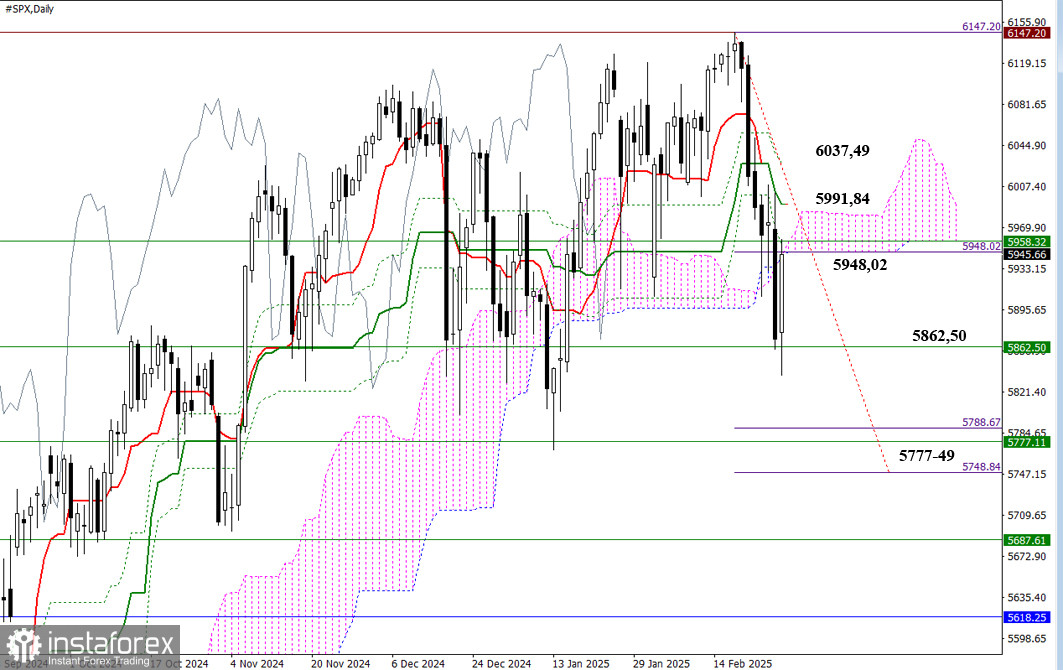
On the daily timeframe, the market is currently working on invalidating the daily cross and breaking the Ichimoku cloud at 5,948.02. If the bears continue the decline in the coming days and break weekly support at 5,862.50, the market will likely aim to fulfill the daily breakout target at 5,748.84 and test the weekly medium-term trend at 5,777.11. Alternatively, for the bulls to regain control, they need to re-enter the bullish zone relative to the daily cloud, retest the recently broken daily Ichimoku cross at 5,991.84 – 6,037.49, and consolidate above these resistance levels.
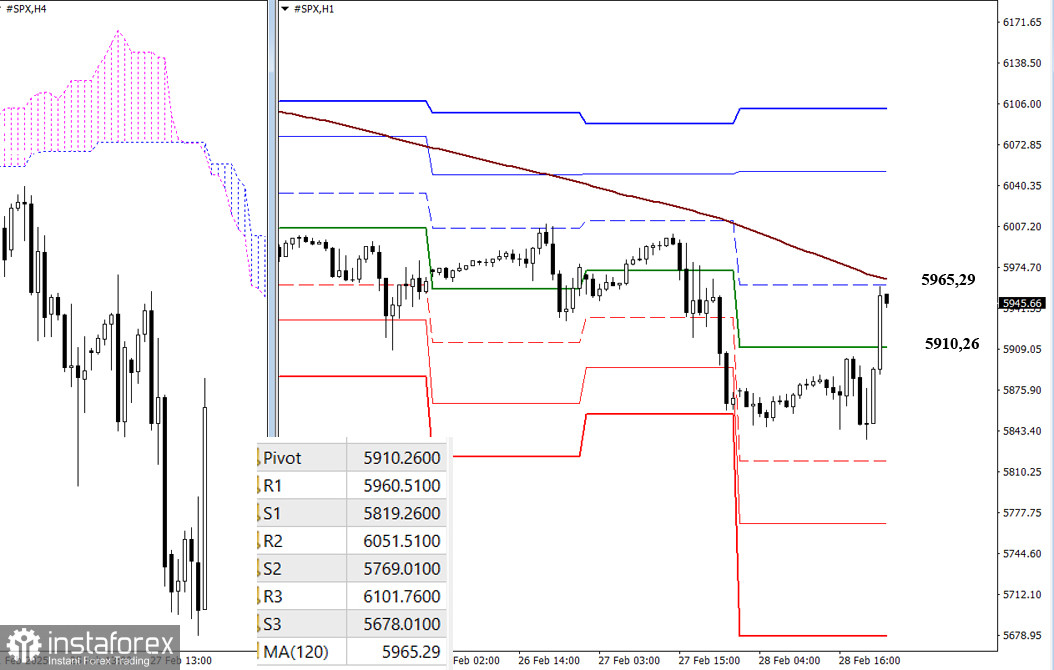
On lower timeframes, the market has closely approached the weekly long-term trend at 5,965.29. The coming trading week may start with a test of this level, which could determine the market's direction. This is the most critical level on lower timeframes, as holding above it favors bullish momentum, with intraday upside targets aligned with classic pivot resistance levels. Conversely, a rejection and move below this level could trigger bearish sentiment, with classic pivot support levels acting as downside targets. These pivot values are updated daily when trading opens.
***
*تعینات کیا مراد ہے مارکیٹ کے تجزیات یہاں ارسال کیے جاتے ہیں جس کا مقصد آپ کی بیداری بڑھانا ہے، لیکن تجارت کرنے کے لئے ہدایات دینا نہیں.
InstaSpot analytical reviews will make you fully aware of market trends! Being an InstaSpot client, you are provided with a large number of free services for efficient trading.


