


انسٹا فاریکس ٹیم میں لیجنڈ!
لیجنڈ!آپ کو لگتا ہے کہ یہ حیرت انگیز بیانات ہے؟ لیکن ہمیں ایسے شخص کو کیا کہنا چاہئے ، جو 18 سال میں جونیئر ورلڈ شطرنج چیمپئن شپ جیتنے والا پہلا ایشین بن گیا تھا اور 19 میں پہلا ہندوستانی گرینڈ ماسٹر بنا؟ ورلڈ چیمپیئن ٹائٹل کے لئے یہ مشکل آغاز تھا جو وشونااتھ آنند کے لئے تھا ، وہ شخص جو ہمیشہ کے لئے شطرنج کی تاریخ کا حصہ بن گیا تھا۔ انسٹا فاریکس ٹیم میں اب ایک اور لیجنڈ!


Borussia is one of the most titled football clubs in Germany, which has repeatedly proved to fans: the spirit of competition and leadership will certainly lead to success. Trade in the same way that sports professionals play the game: confidently and actively. Keep a "pass" from Borussia FC and be in the lead with InstaSpot!

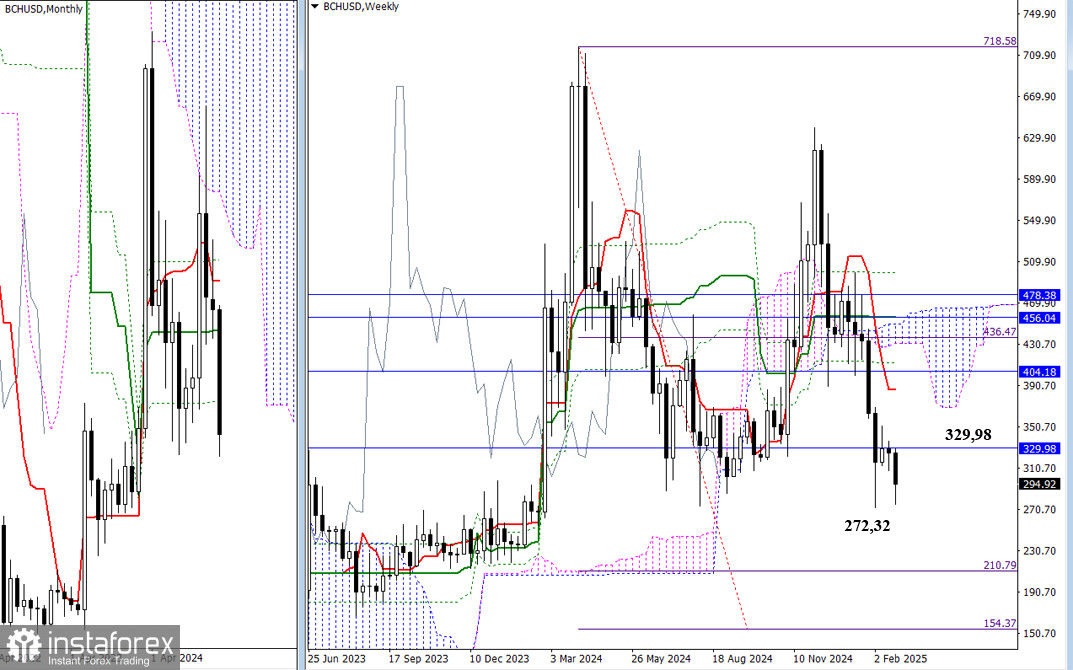
The attempt to update the lowest extremum of 272.32 and restore the downtrend has not yet been achieved by bullish players. Without clear results, no new prospects can be identified. In this part of the chart, the next bearish target is the weekly objective of breaking through the Ichimoku cloud, which ranges from 154.37 to 210.79. If the bears are unsuccessful, the bulls will continue to operate within the influence zone of the final level indicated by the monthly Ichimoku cross at 329.98.
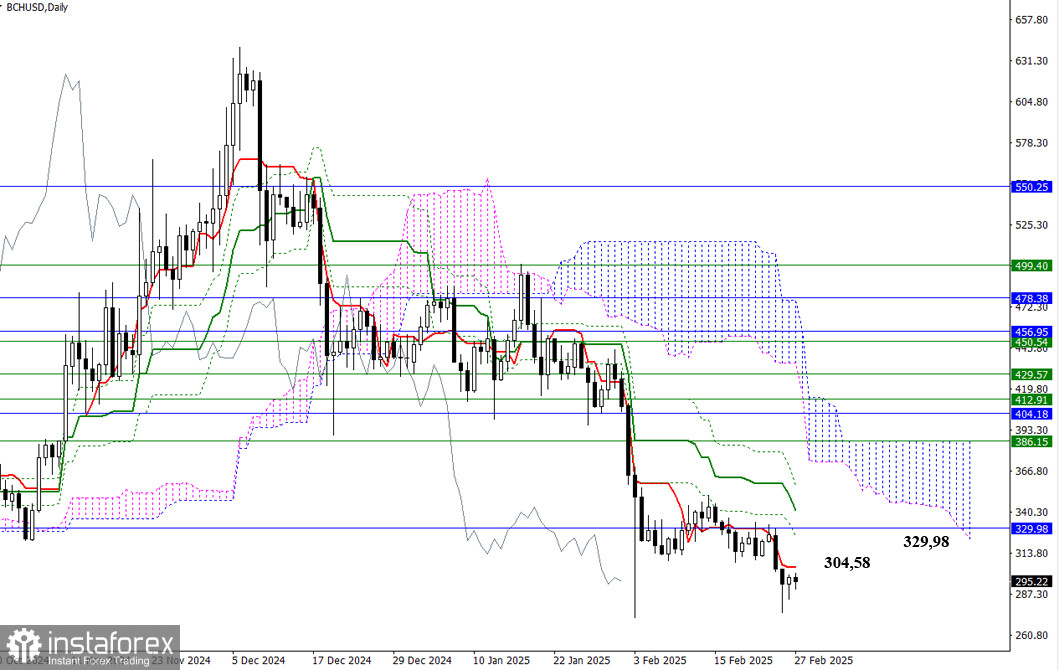
On the daily timeframe, around the monthly boundary of 329.98, there are several daily resistance levels: 304.58, 324.96, 341.22, and 357.47. Any of these levels could contribute to the restoration of bearish positions, while new bullish opportunities will only arise after the daily Ichimoku dead cross is eliminated.
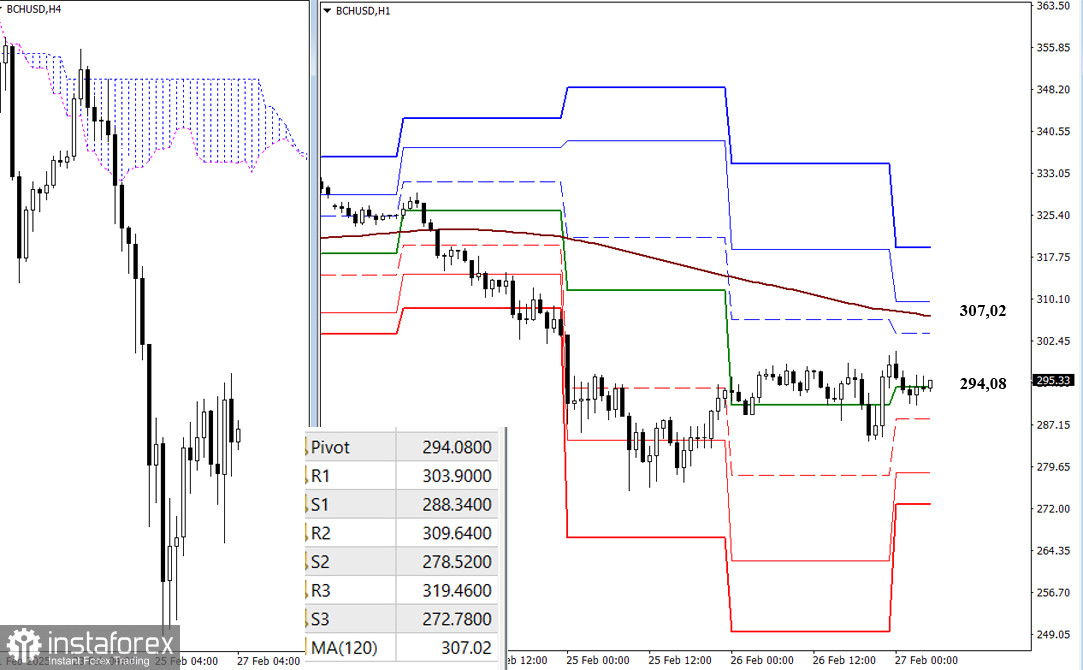
On lower timeframes, the upward correction has gradually led the market to test key reference points. Currently, the market is interacting with the central daily Pivot level at 294.08, and further correction could target the weekly long-term trend level of 307.02. A breakout here might shift the existing balance of power. Additionally, intraday resistance levels for bullish players are found at the classic Pivot levels of 303.90, 309.64, and 319.46. If the corrective rise comes to an end, there will likely be a strengthening of bearish sentiment, particularly if support at the classic Pivot levels of 288.34, 278.52, and 272.78 is broken down.
***
*تعینات کیا مراد ہے مارکیٹ کے تجزیات یہاں ارسال کیے جاتے ہیں جس کا مقصد آپ کی بیداری بڑھانا ہے، لیکن تجارت کرنے کے لئے ہدایات دینا نہیں.
InstaSpot analytical reviews will make you fully aware of market trends! Being an InstaSpot client, you are provided with a large number of free services for efficient trading.


