


ہمارے ٹیم میں 7000000 سے ذائد تاجران شامل ہیں
ہم تجارت کی بہتری کے لئے ہر روز اکھٹے کام کرتے ہیں اور بہترین نتائج حاصل کرتے ہوئے آگے کی جانب بڑھتے ہیں
دُنیا بھر سے سے لاکھوں ہمارے بہترین کام کو سند عطاء کرتے ہیں آپ اپنا انتحاب کریں باقی ہم آپ کی توقعات پر پورا اترنے کے لئے اپنی بہترین کوشش کریں گے
ہم مل کر ایک بہترین ٹیم بناتے ہیں
انسٹا فاریکس آپ سے کام کرتے ہوئے فخر محسوس کرتا ہے


ایکٹر - یو سی ایف 6 ٹورنامنٹ چیمپین اور واقعی ہیرو
ایک فرد کے جس نے اپنا آپ منوایا ہے وہ فرد کہ جو ہماری راہ پر چلا ہے.
ٹکٹا روو کی کامیابی کا راز یہ ہے کہ وہ اپنے اہداف کی جانب مسلسل بڑھتا رہتا ہے
اپنے ہنر یا ٹیلنٹ کے تمام پہلو آشکار کررہے ہیں
پہچانیں ، کوشش کریں ، ناکام ہوں لیکن کبھی نہ رُکیں
انسٹا فاریکس آپ کی کامیابی کی کہاں یہاں سے شروع ہوتی ہے

EUR/USD
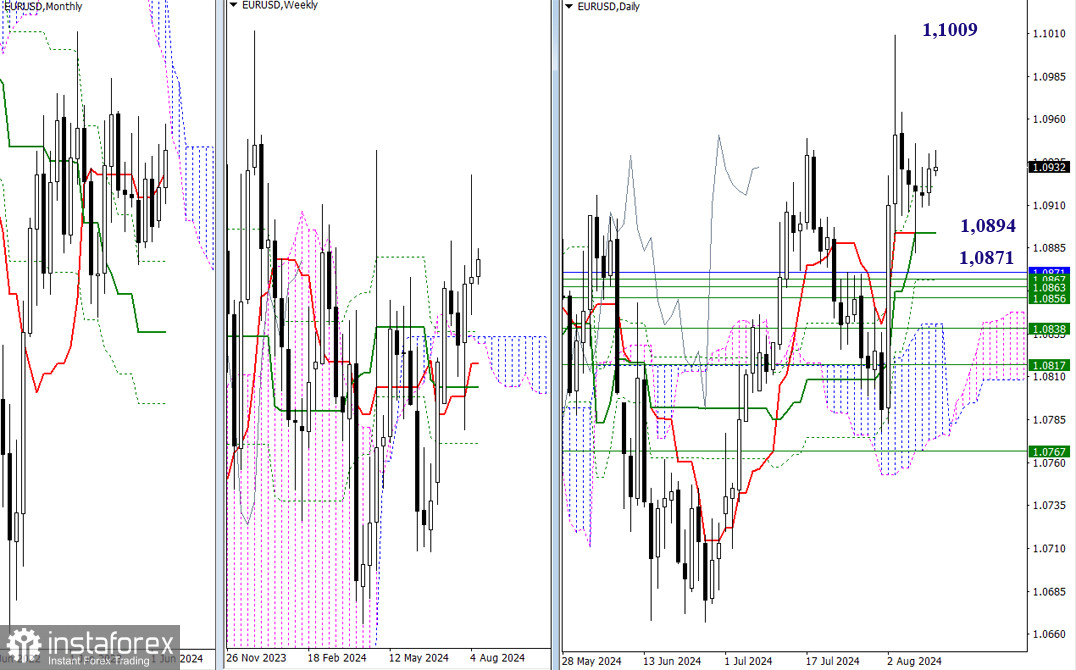
Higher timeframes
No major changes have been recorded over the past 24 hours. The EUR/USD pair remains within the current consolidation range. All previously indicated crucial levels have retained their positions. For bullish traders, it is crucial to test and overcome the nearest high at 1.1009 under the current market conditions. For bearish traders, two key levels might be significant in the near term: 1.0894 (the convergence of key daily Ichimoku levels) and 1.0871 (the monthly short-term trend, reinforcing the area of weekly support levels).
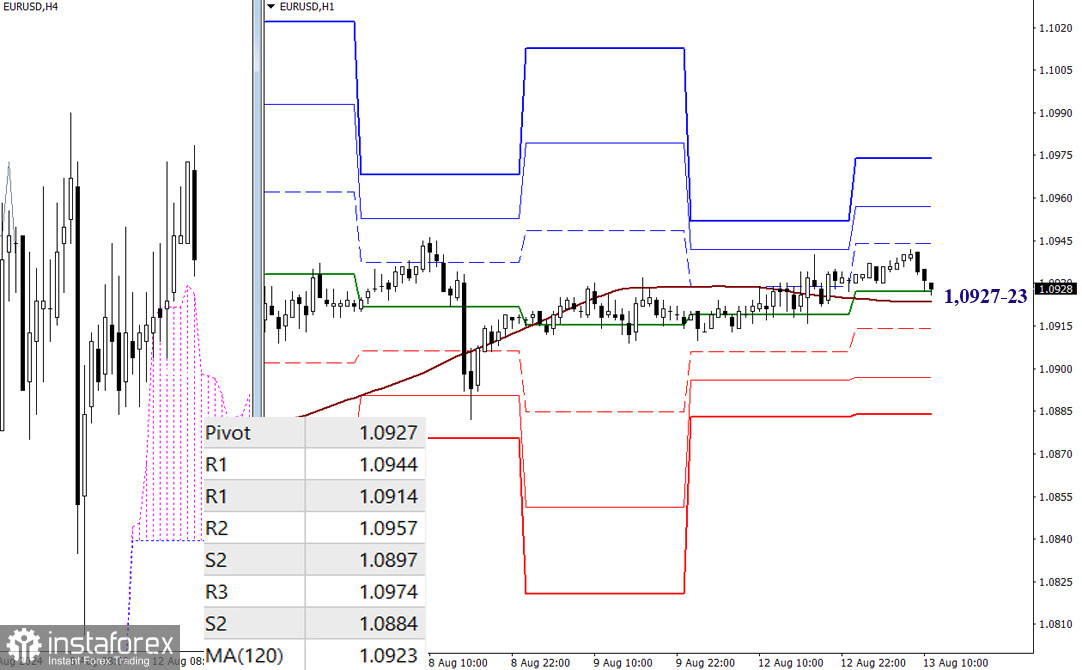
H4 – H1
Lower timeframes
Bullish traders continue to hold the upper hand on lower timeframes, as EUR/USD is trading above key levels situated close to each other: 1.0927 (the central daily Pivot level) and 1.0923 (the weekly long-term trend). However, the market is currently in a correction phase and testing key levels. The outcome of this bullish sequence could alter the existing balance of power. Should a directional movement develop, classic pivot levels may come into play. In this case, bearish traders will encounter support at 1.0914 – 1.0897 – 1.0884, while bullish traders will face resistance at 1.0944 – 1.0957 – 1.0974.
GBP/USD
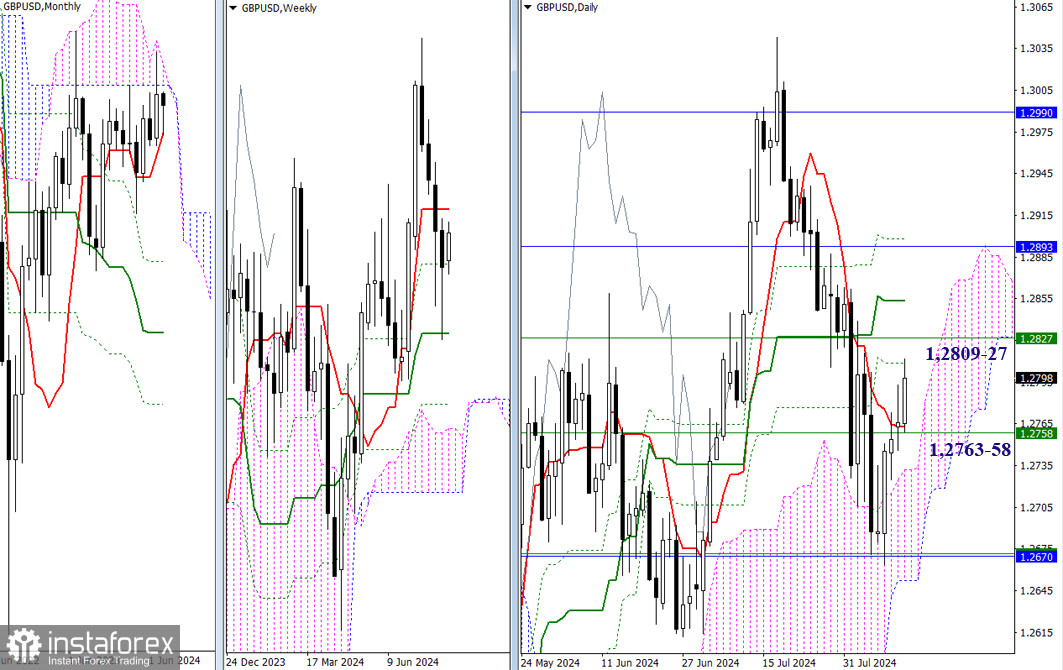
Higher timeframes
The daily short-term trend (1.2763) has not been able to halt the upward correction. EUR/USD is extending its rise. The instrument has begun testing the next resistances of the daily Ichimoku dead cross. The current level is Fib Kijun (1.2809). Bullish traders are looking ahead to 1.2827 (the weekly short-term trend), 1.2853 (the daily medium-term trend), and 1.2893-98 (the lower border of the monthly cloud + the final level of the daily cross).
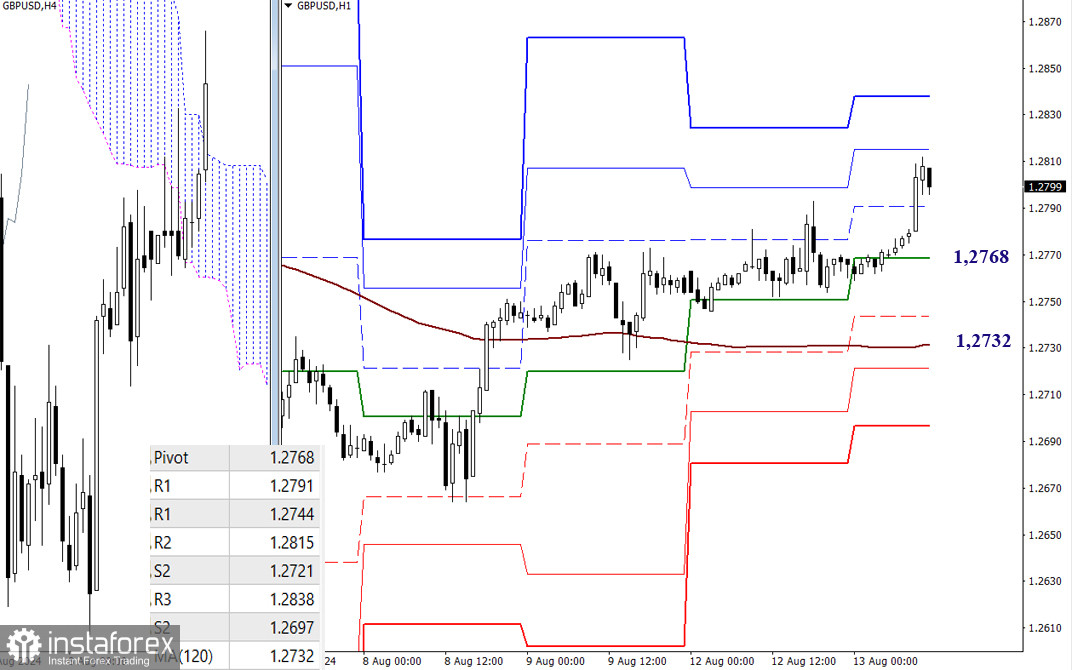
H4 – H1
Bullish traders hold the advantage on lower timeframes as well, driving the rise. Currently, they are testing the influence zone of the second resistance of the classic pivot levels (1.2815). The next bullish target remains the resistance R3 (1.2838). If priorities are revised and a corrective decline develops, the main focus will be the interaction with key lower timeframe levels, currently noted at 1.2768 (the central pivot level) and 1.2732 (the weekly long-term trend). A breakout and reversal of the trend could change the existing balance of power.
***
This technical analysis is based on the following ideas:
Larger timeframes - Ichimoku Kinko Hyo (9.26.52) + Fibo Kijun levels
H1 – classic pivot points + 120-period Moving Average (weekly long-term trendline)
*تعینات کیا مراد ہے مارکیٹ کے تجزیات یہاں ارسال کیے جاتے ہیں جس کا مقصد آپ کی بیداری بڑھانا ہے، لیکن تجارت کرنے کے لئے ہدایات دینا نہیں.
InstaSpot analytical reviews will make you fully aware of market trends! Being an InstaSpot client, you are provided with a large number of free services for efficient trading.


