


ہمارے ٹیم میں 7000000 سے ذائد تاجران شامل ہیں
ہم تجارت کی بہتری کے لئے ہر روز اکھٹے کام کرتے ہیں اور بہترین نتائج حاصل کرتے ہوئے آگے کی جانب بڑھتے ہیں
دُنیا بھر سے سے لاکھوں ہمارے بہترین کام کو سند عطاء کرتے ہیں آپ اپنا انتحاب کریں باقی ہم آپ کی توقعات پر پورا اترنے کے لئے اپنی بہترین کوشش کریں گے
ہم مل کر ایک بہترین ٹیم بناتے ہیں
انسٹا فاریکس آپ سے کام کرتے ہوئے فخر محسوس کرتا ہے


ایکٹر - یو سی ایف 6 ٹورنامنٹ چیمپین اور واقعی ہیرو
ایک فرد کے جس نے اپنا آپ منوایا ہے وہ فرد کہ جو ہماری راہ پر چلا ہے.
ٹکٹا روو کی کامیابی کا راز یہ ہے کہ وہ اپنے اہداف کی جانب مسلسل بڑھتا رہتا ہے
اپنے ہنر یا ٹیلنٹ کے تمام پہلو آشکار کررہے ہیں
پہچانیں ، کوشش کریں ، ناکام ہوں لیکن کبھی نہ رُکیں
انسٹا فاریکس آپ کی کامیابی کی کہاں یہاں سے شروع ہوتی ہے

EUR/USD
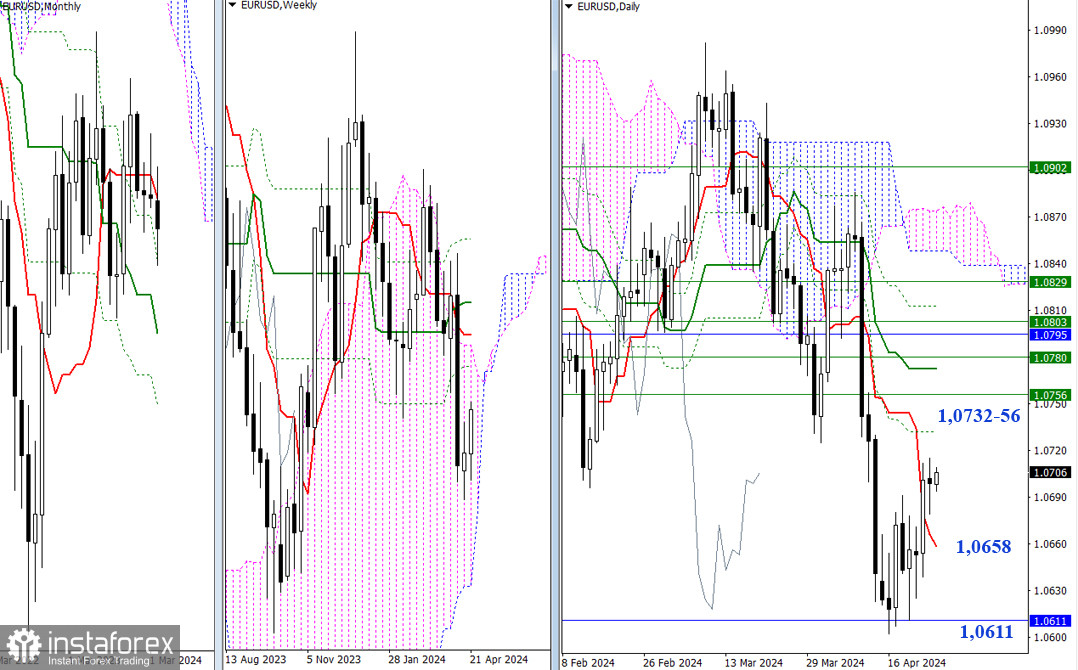
Higher Timeframes
Yesterday, volume and volatility remained low. Nevertheless, the market maintained its position above the daily short-term trend. As a result, the main conclusions and expectations remain unchanged. For bulls, the nearest resistances around 1.0732-56 (daily and weekly Fibonacci Kijun levels) may still serve as reference points, while bears can look to the daily short-term trend (1.0658) and the monthly Fibonacci Kijun (1.0611).
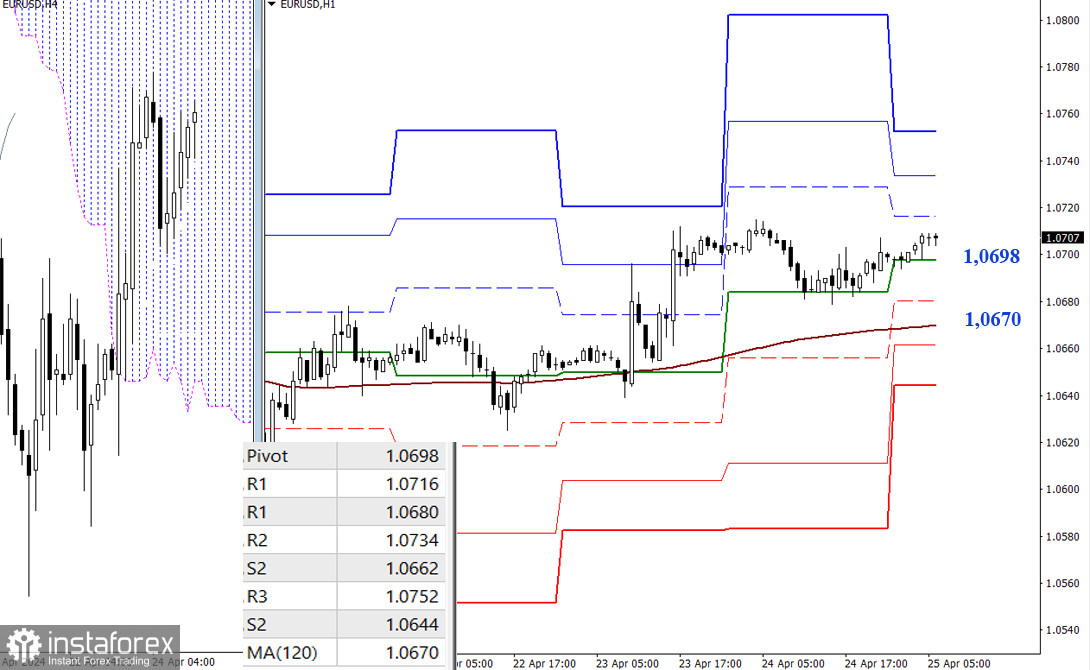
H4 – H1
On the lower timeframes, the pair is still going through a correction. In case the price breaks out of it, which requires testing yesterday's high (1.0715), resistance to bullish movement may come from the classical Pivot levels R1 (1.0716) - R2 (1.0734) - R3 (1.0752). As the pair continues to go through a correction, key levels gain importance - the central Pivot level (1.0698) and the weekly long-term trend (1.0670). A breakout and a trend reversal will change the current balance of power and strengthen the bears. Today, additional intraday supports can be found at 1.0662 - 1.0644 (classic Pivot levels).
***
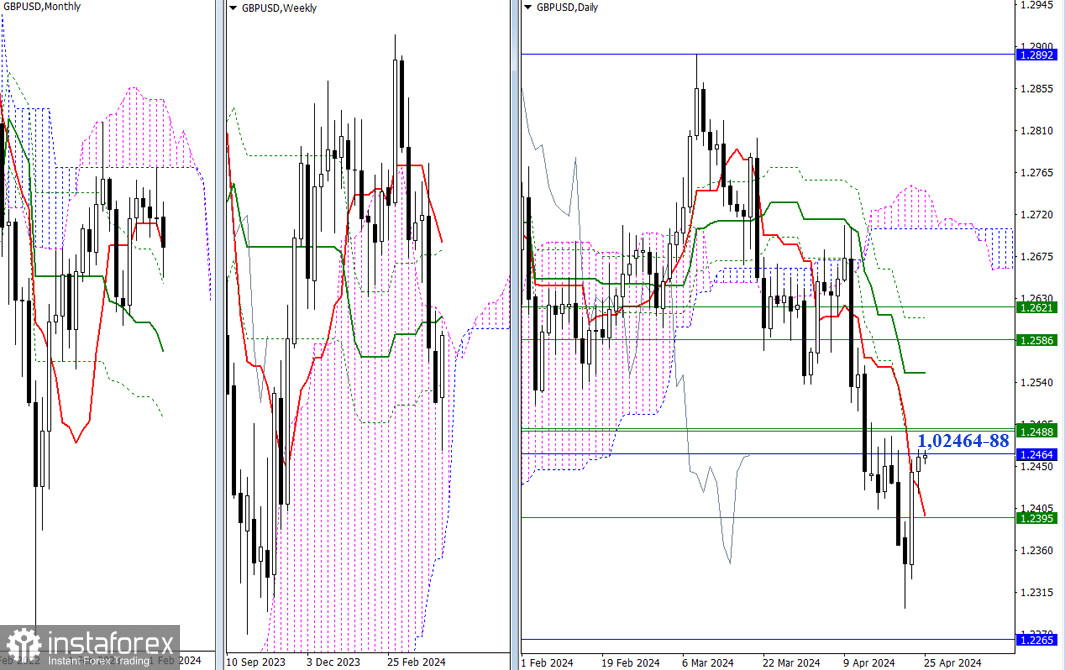
Higher Timeframes
The bullish correction brought the pair to test the nearest resistance area, which combines monthly and weekly levels (1.2464-88). The outcome will determine possible scenarios. In the event of a breakthrough, the bulls will have new prospects, while in case of a rebound, the focus will return to the area around 1.2395 (the final level of the weekly Ichimoku cross + the daily short-term trend).
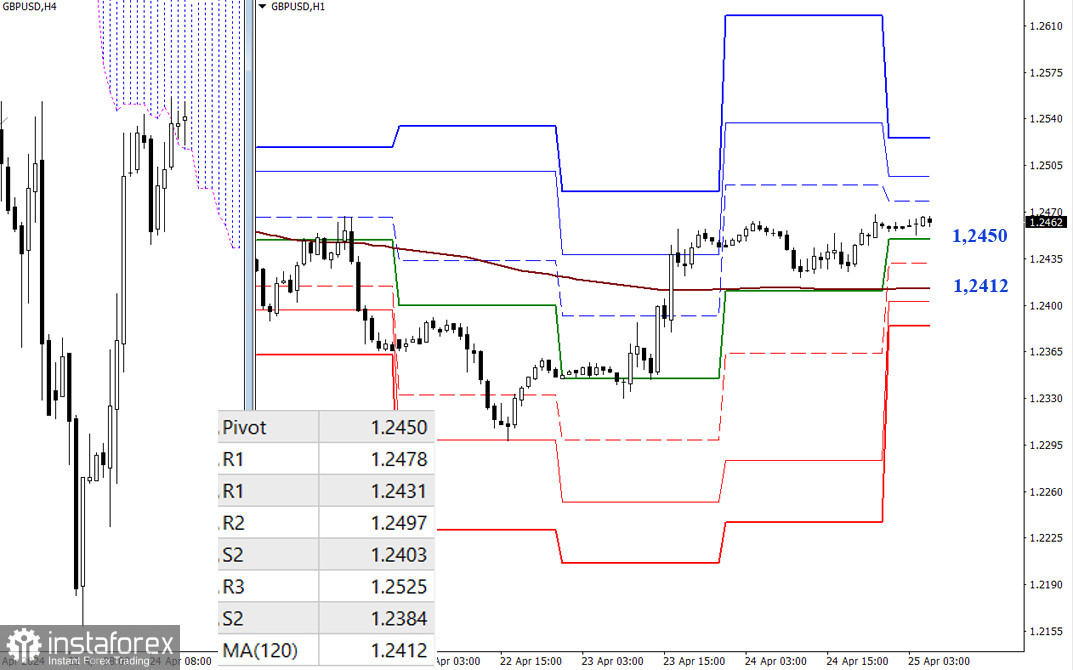
H4 – H1
The pair has updated the previous high and continues to strive for further upward movement. On the lower timeframes, the classic Pivot levels serve as reference points for continuing the ascent (1.2478 - 1.2497 - 1.2525). If the opponent grabs the initiative, then today, corrective targets can be found at 1.2450 (the central Pivot level of the day) and 1.2412 (the weekly long-term trend). Further intraday support levels may come from the classical Pivot levels S2 (1.2403) and S3 (1.2384).
***
The technical analysis of the situation uses:
Higher timeframes - Ichimoku Kinko Hyo (9.26.52) + Fibonacci Kijun levels
Lower timeframes - H1 - Pivot Points (classic) + Moving Average 120 (weekly long-term trend)
*تعینات کیا مراد ہے مارکیٹ کے تجزیات یہاں ارسال کیے جاتے ہیں جس کا مقصد آپ کی بیداری بڑھانا ہے، لیکن تجارت کرنے کے لئے ہدایات دینا نہیں.
InstaSpot analytical reviews will make you fully aware of market trends! Being an InstaSpot client, you are provided with a large number of free services for efficient trading.


