


ہمارے ٹیم میں 7000000 سے ذائد تاجران شامل ہیں
ہم تجارت کی بہتری کے لئے ہر روز اکھٹے کام کرتے ہیں اور بہترین نتائج حاصل کرتے ہوئے آگے کی جانب بڑھتے ہیں
دُنیا بھر سے سے لاکھوں ہمارے بہترین کام کو سند عطاء کرتے ہیں آپ اپنا انتحاب کریں باقی ہم آپ کی توقعات پر پورا اترنے کے لئے اپنی بہترین کوشش کریں گے
ہم مل کر ایک بہترین ٹیم بناتے ہیں
انسٹا فاریکس آپ سے کام کرتے ہوئے فخر محسوس کرتا ہے


ایکٹر - یو سی ایف 6 ٹورنامنٹ چیمپین اور واقعی ہیرو
ایک فرد کے جس نے اپنا آپ منوایا ہے وہ فرد کہ جو ہماری راہ پر چلا ہے.
ٹکٹا روو کی کامیابی کا راز یہ ہے کہ وہ اپنے اہداف کی جانب مسلسل بڑھتا رہتا ہے
اپنے ہنر یا ٹیلنٹ کے تمام پہلو آشکار کررہے ہیں
پہچانیں ، کوشش کریں ، ناکام ہوں لیکن کبھی نہ رُکیں
انسٹا فاریکس آپ کی کامیابی کی کہاں یہاں سے شروع ہوتی ہے

EUR/USD
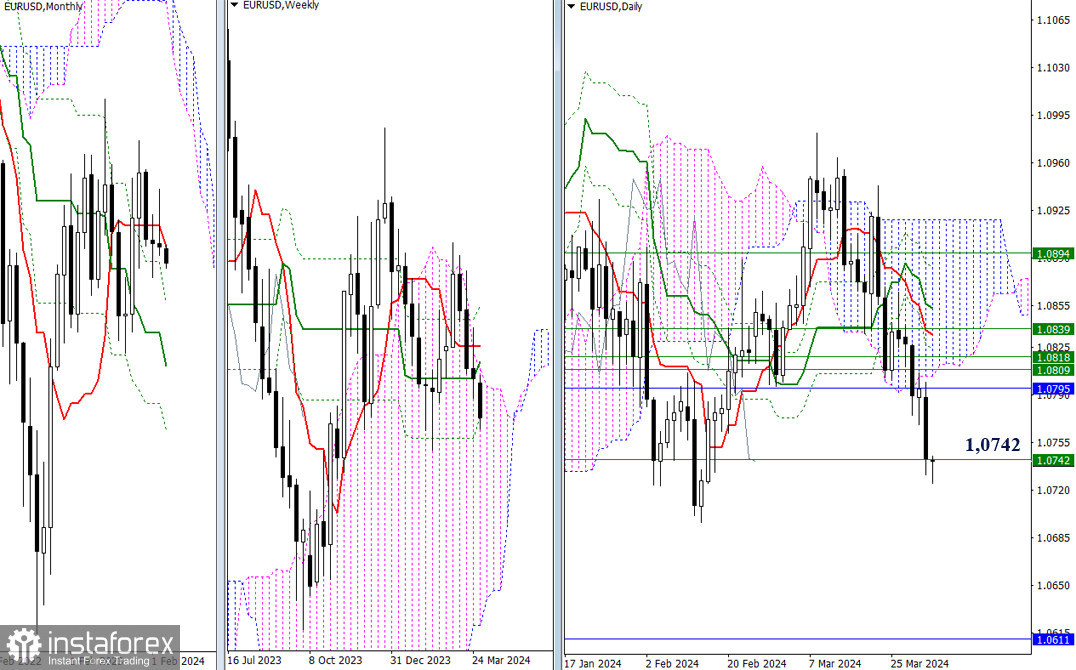
Higher Timeframes
Yesterday, the bears continued their downward pressure and reached the final support of the weekly Ichimoku cross (1.0742). Breaking the golden cross will open up new prospects for the bearish part of the market. As a result, we can expect a retest of the low (1.0696) and testing of the monthly support (1.0611).
Previously passed levels today act as resistances. In case of a retest, the market will encounter levels between 1.0795 – 1.0809 – 1.0818 – 1.0839.
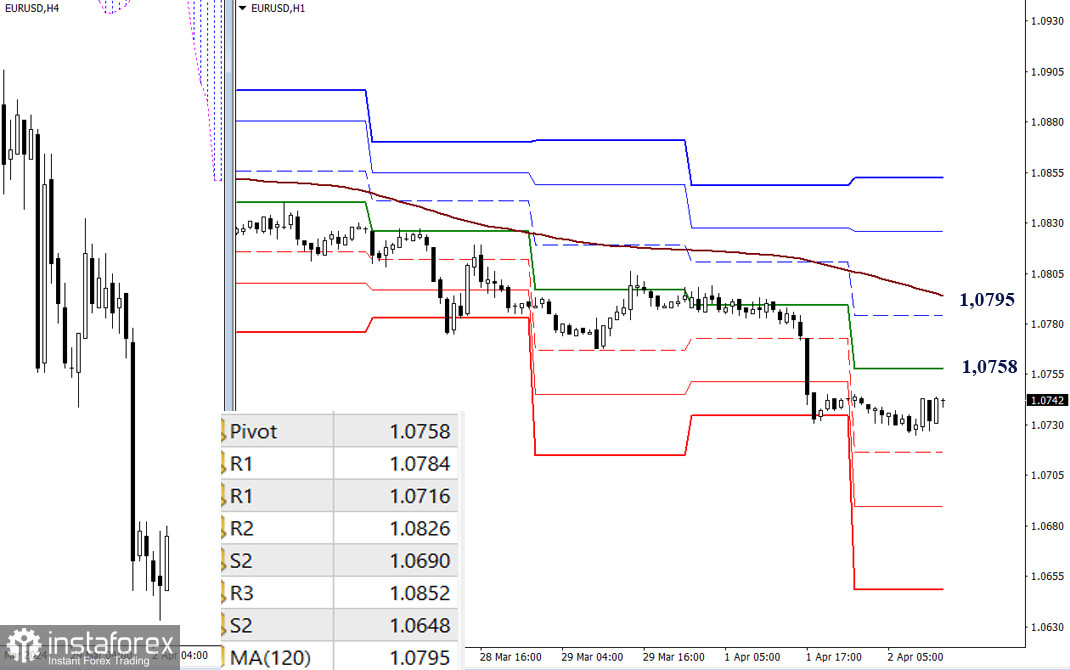
H4 – H1
On lower timeframes, the main advantage belongs to the bears. They recently marked a new low and are now undergoing a correction. For an upward movement, the market can use key resistances of lower timeframes, such as 1.0758 (central pivot point of the day) – 1.0795 (weekly long-term trend). Consolidation above these levels may change the current balance of power.
Additional reference points today may also be the supports (1.0716 – 1.0690 – 1.0648) and resistances (1.0826 – 1.0822) of classic pivot points.
***
GBP/USD
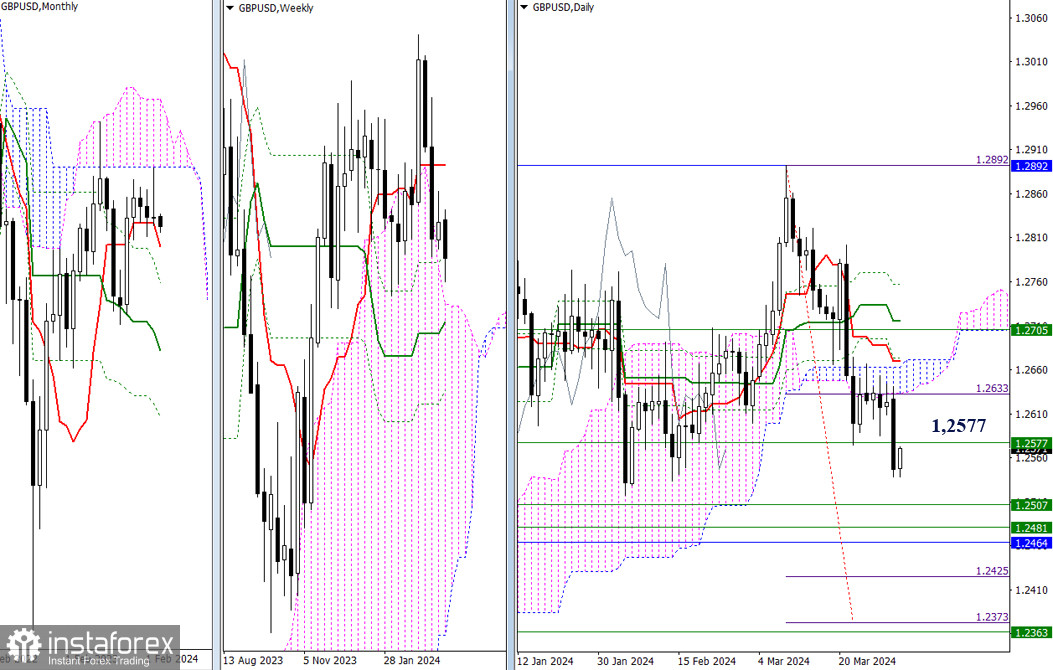
Higher Timeframes
Yesterday, the bears updated the lows of the previous weeks, starting with the weekly support (1.2577). This level may now attract attention and restrain the situation. If the decline continues, then bears will first encounter a fairly strong and wide support zone at 1.2507 – 1.2481 – 1.2464 (weekly medium-term trend + upper boundary of the weekly cloud + monthly short-term trend), and then bearish attention will be focused on fulfilling the daily target for breaking the Ichimoku cloud (1.2373 – 1.2475).
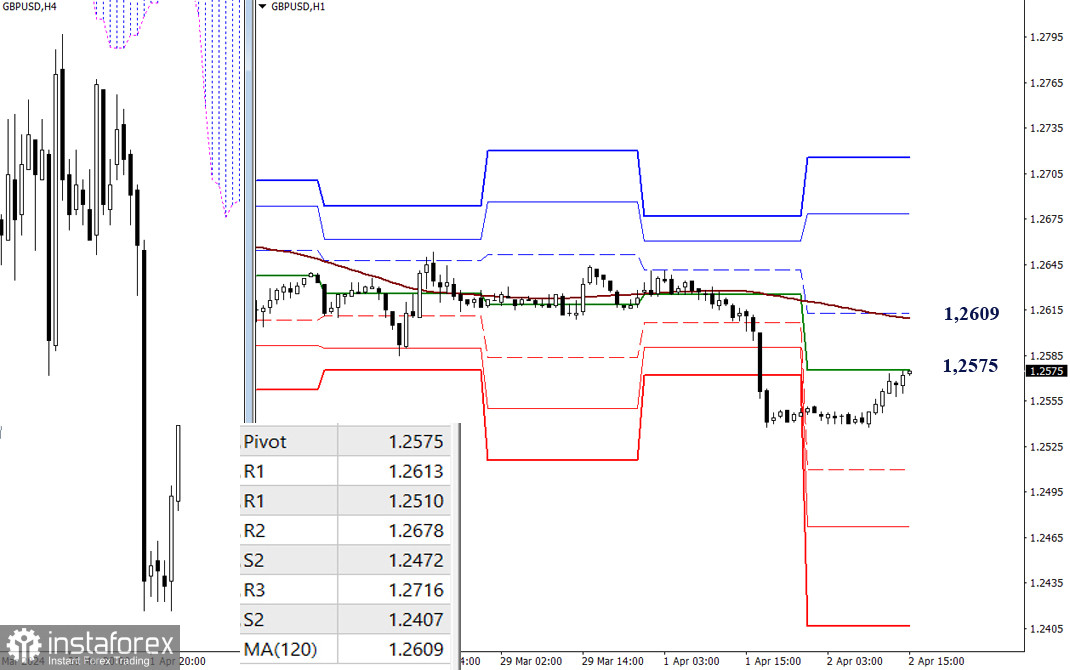
H4 – H1
The main advantage on lower timeframes remains on the side of the bulls. At the moment, an upward correction is developing, with the pair testing the central pivot point of the day (1.2575). Changing the current balance of power is only possible by rising above and overcoming the resistance of the weekly long-term trend (1.2609). The next bullish reference points will be 1.2678 – 1.2716 (resistances of classic pivot points). If the current correction ends, then a continuation of the decline will be organized through the supports of classic pivot points (1.2510 – 1.2472 – 1.2407).
***
The technical analysis of the situation uses:
Higher timeframes - Ichimoku Kinko Hyo (9.26.52) + Fibonacci Kijun levels
Lower timeframes - H1 - Pivot Points (classic) + Moving Average 120 (weekly long-term trend)
*تعینات کیا مراد ہے مارکیٹ کے تجزیات یہاں ارسال کیے جاتے ہیں جس کا مقصد آپ کی بیداری بڑھانا ہے، لیکن تجارت کرنے کے لئے ہدایات دینا نہیں.
InstaSpot analytical reviews will make you fully aware of market trends! Being an InstaSpot client, you are provided with a large number of free services for efficient trading.


