


ہمارے ٹیم میں 7000000 سے ذائد تاجران شامل ہیں
ہم تجارت کی بہتری کے لئے ہر روز اکھٹے کام کرتے ہیں اور بہترین نتائج حاصل کرتے ہوئے آگے کی جانب بڑھتے ہیں
دُنیا بھر سے سے لاکھوں ہمارے بہترین کام کو سند عطاء کرتے ہیں آپ اپنا انتحاب کریں باقی ہم آپ کی توقعات پر پورا اترنے کے لئے اپنی بہترین کوشش کریں گے
ہم مل کر ایک بہترین ٹیم بناتے ہیں
انسٹا فاریکس آپ سے کام کرتے ہوئے فخر محسوس کرتا ہے


ایکٹر - یو سی ایف 6 ٹورنامنٹ چیمپین اور واقعی ہیرو
ایک فرد کے جس نے اپنا آپ منوایا ہے وہ فرد کہ جو ہماری راہ پر چلا ہے.
ٹکٹا روو کی کامیابی کا راز یہ ہے کہ وہ اپنے اہداف کی جانب مسلسل بڑھتا رہتا ہے
اپنے ہنر یا ٹیلنٹ کے تمام پہلو آشکار کررہے ہیں
پہچانیں ، کوشش کریں ، ناکام ہوں لیکن کبھی نہ رُکیں
انسٹا فاریکس آپ کی کامیابی کی کہاں یہاں سے شروع ہوتی ہے

EUR/USD
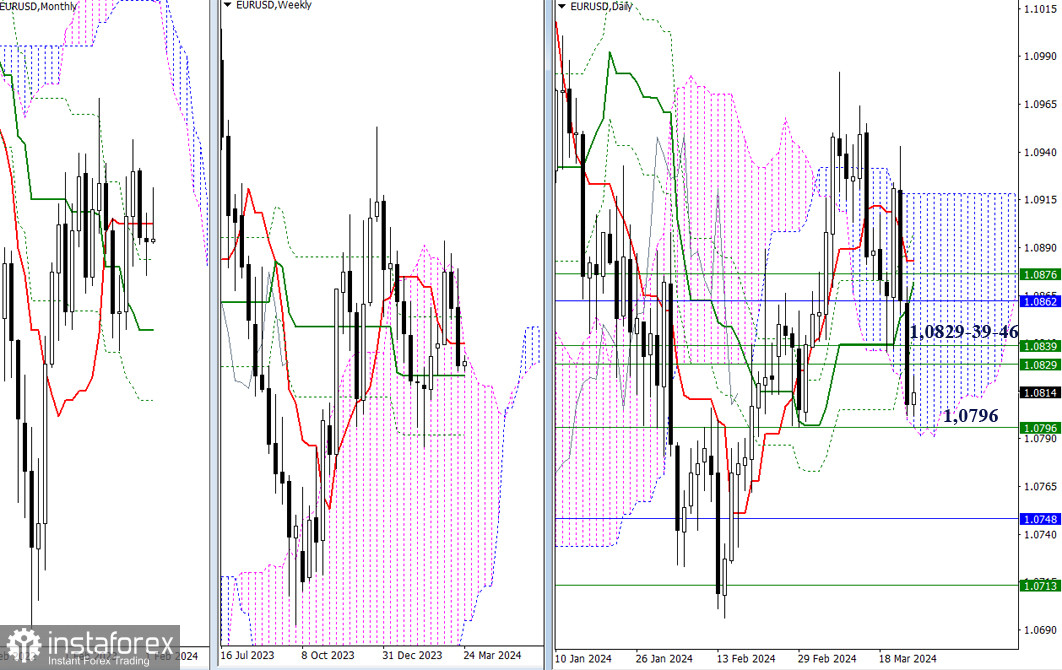
Higher Timeframes
Last week recorded a bearish outcome. Now, to solidify it and continue the decline, bearish players must exit the daily cloud (1.0792) and firmly consolidate in the bearish zone of the relative cloud, simultaneously overcoming the area of attraction and influence of the weekly medium-term trend (1.0796). After that, new prospects will open up for them in the form of monthly support (1.0748) and the final level of the golden cross of the weekly Ichimoku cloud (1.0713).
If bears now take a pause, the recovery of bullish positions will primarily pass through two important resistance areas 1.0829-39-46 and 1.0862-76-83. The first boundaries will allow the return of the weekly short-term trend and re-establishment in the bullish zone relative to the weekly cloud, while the second area will facilitate the transition to the bullish side of the monthly short-term trend and some weekly and daily levels.
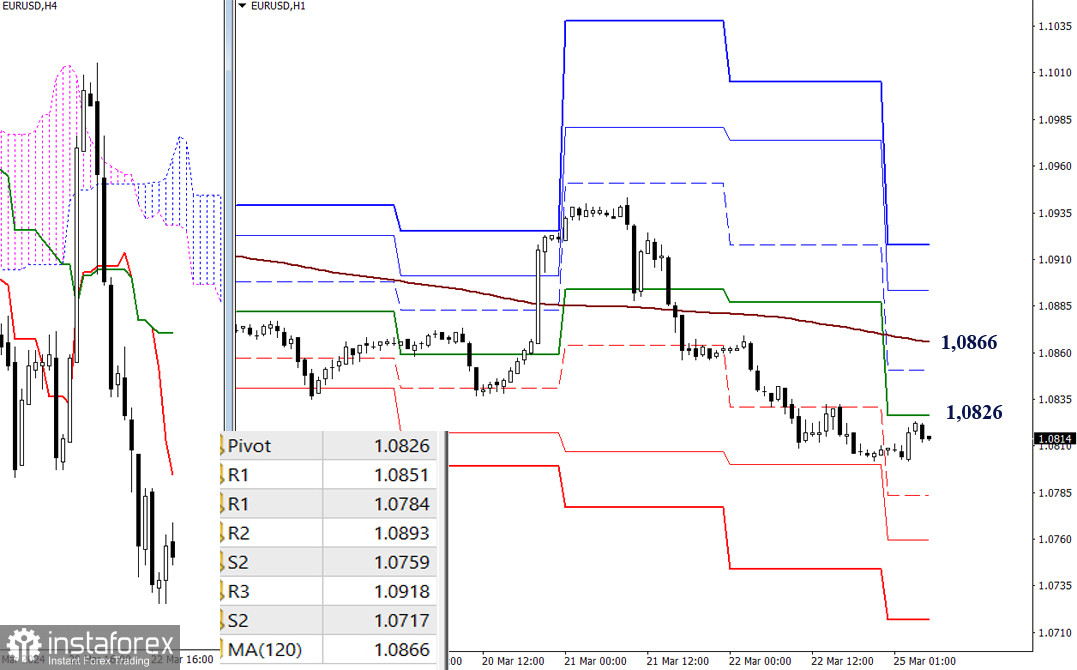
H4 - H1
On lower timeframes, the current main advantage belongs to bearish players. However, the pair is currently in a corrective upward trend, with the key levels of lower timeframes today located at 1.0826 (central pivot point of the day) and 1.0866 (weekly long-term trend). Consolidation above will change the current balance of power, directing attention higher towards the resistances of classic pivot points (1.0893 - 1.0918).
The bearish scenario, after exiting the correction zone, will pass through the passage of supports of classic pivot points (1.0784 - 1.0759 - 1.0717).
***
GBP/USD
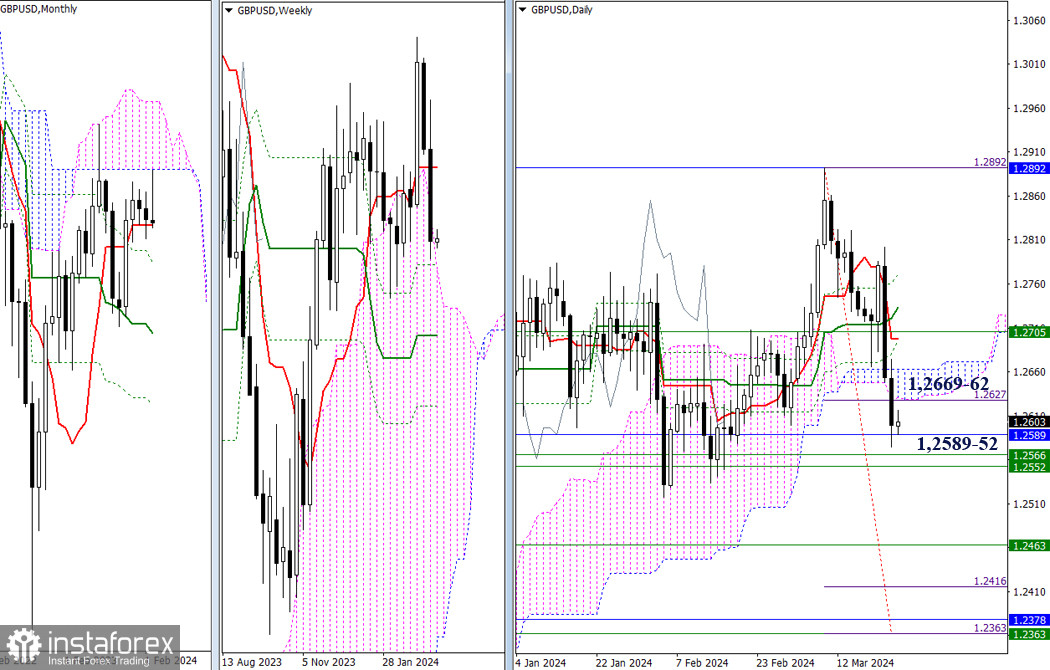
Higher timeframes
Bearish players last week managed to break out of the daily bearish Ichimoku cloud. In addition, they began testing the reinforced support area of 1.2589-66-52 (weekly and monthly levels). The result of this interaction may determine the course of events in the near term. A breakout will allow considering such prospects as achieving the daily target for breaking the Ichimoku cloud and liquidating the golden cross of the weekly Ichimoku cloud. A rebound will contribute to a retest of the previously passed daily cloud (1.2629 - 1.2662), while further upward movement will raise questions about the return of support for the weekly short-term trend (1.2705) and the liquidation of the recently formed death cross of the daily Ichimoku cloud.
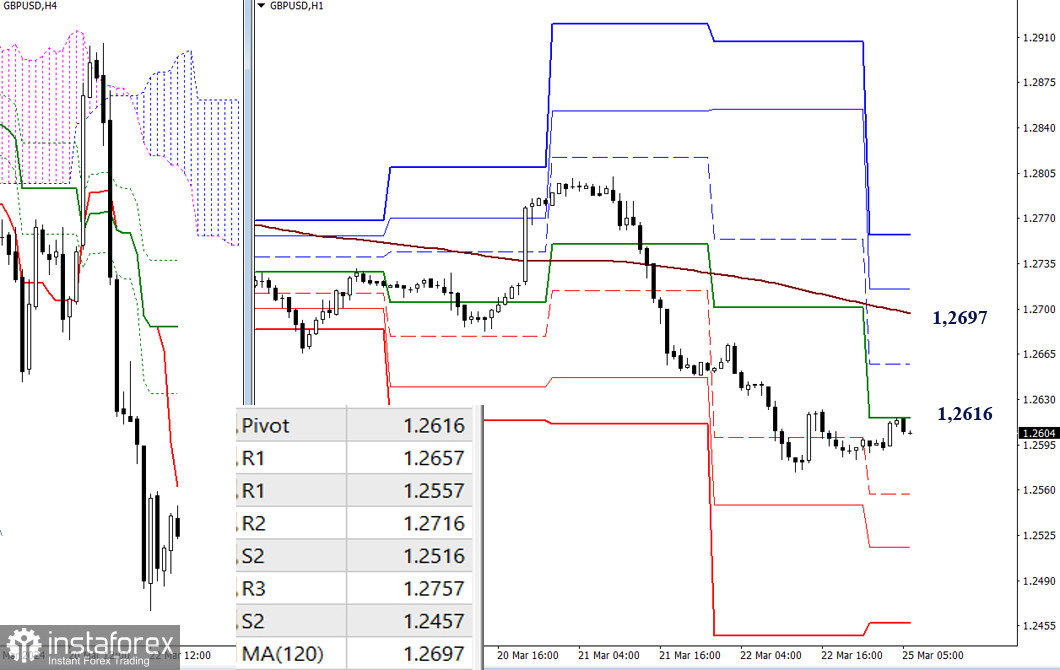
H4 - H1
In the current conditions, bearish players hold the main advantage, although the market is currently in a correction zone. The development of a corrective upward trend will lead the pair to test key levels of lower timeframes - 1.2616 (central pivot point of the day) and 1.2697 (weekly long-term trend). Intermediate resistance on this path may come at R1 (1.2657).
A return to the bear market during the day will lead to testing supports of classic pivot points (1.2557 - 1.2516 - 1.2457).
***
The technical analysis of the situation uses:
Higher timeframes - Ichimoku Kinko Hyo (9.26.52) + Fibonacci Kijun levels
Lower timeframes - H1 - Pivot Points (classic) + Moving Average 120 (weekly long-term trend)
*تعینات کیا مراد ہے مارکیٹ کے تجزیات یہاں ارسال کیے جاتے ہیں جس کا مقصد آپ کی بیداری بڑھانا ہے، لیکن تجارت کرنے کے لئے ہدایات دینا نہیں.
InstaSpot analytical reviews will make you fully aware of market trends! Being an InstaSpot client, you are provided with a large number of free services for efficient trading.


