


ہمارے ٹیم میں 7000000 سے ذائد تاجران شامل ہیں
ہم تجارت کی بہتری کے لئے ہر روز اکھٹے کام کرتے ہیں اور بہترین نتائج حاصل کرتے ہوئے آگے کی جانب بڑھتے ہیں
دُنیا بھر سے سے لاکھوں ہمارے بہترین کام کو سند عطاء کرتے ہیں آپ اپنا انتحاب کریں باقی ہم آپ کی توقعات پر پورا اترنے کے لئے اپنی بہترین کوشش کریں گے
ہم مل کر ایک بہترین ٹیم بناتے ہیں
انسٹا فاریکس آپ سے کام کرتے ہوئے فخر محسوس کرتا ہے


ایکٹر - یو سی ایف 6 ٹورنامنٹ چیمپین اور واقعی ہیرو
ایک فرد کے جس نے اپنا آپ منوایا ہے وہ فرد کہ جو ہماری راہ پر چلا ہے.
ٹکٹا روو کی کامیابی کا راز یہ ہے کہ وہ اپنے اہداف کی جانب مسلسل بڑھتا رہتا ہے
اپنے ہنر یا ٹیلنٹ کے تمام پہلو آشکار کررہے ہیں
پہچانیں ، کوشش کریں ، ناکام ہوں لیکن کبھی نہ رُکیں
انسٹا فاریکس آپ کی کامیابی کی کہاں یہاں سے شروع ہوتی ہے

EUR/USD
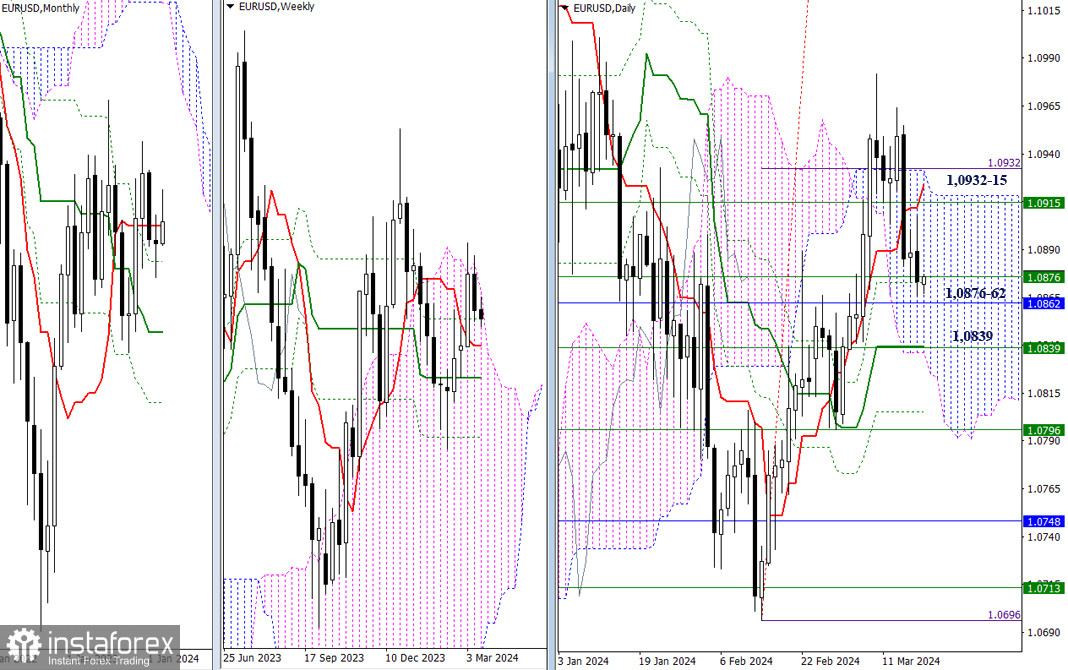
Higher Timeframes
The pair continues testing nearby supports. The zone 1.0876 - 1.0862 - 1.0839 combines many strong levels across various timeframes and is the most important on this section of the chart. Its breakthrough will allow capturing short-term trends of the highest timeframes (weeks and months). Further bearish advancement will raise questions about the elimination of the daily Ichimoku cross and exiting the daily cloud, with the strengthening of these tasks served by the weekly medium-term trend (1.0796).
For bulls, the task remains unchanged. First and foremost, they need to breach into the bullish zone of the daily (1.0932) and weekly (1.0915) Ichimoku clouds. A secure consolidation above will open up new prospects.
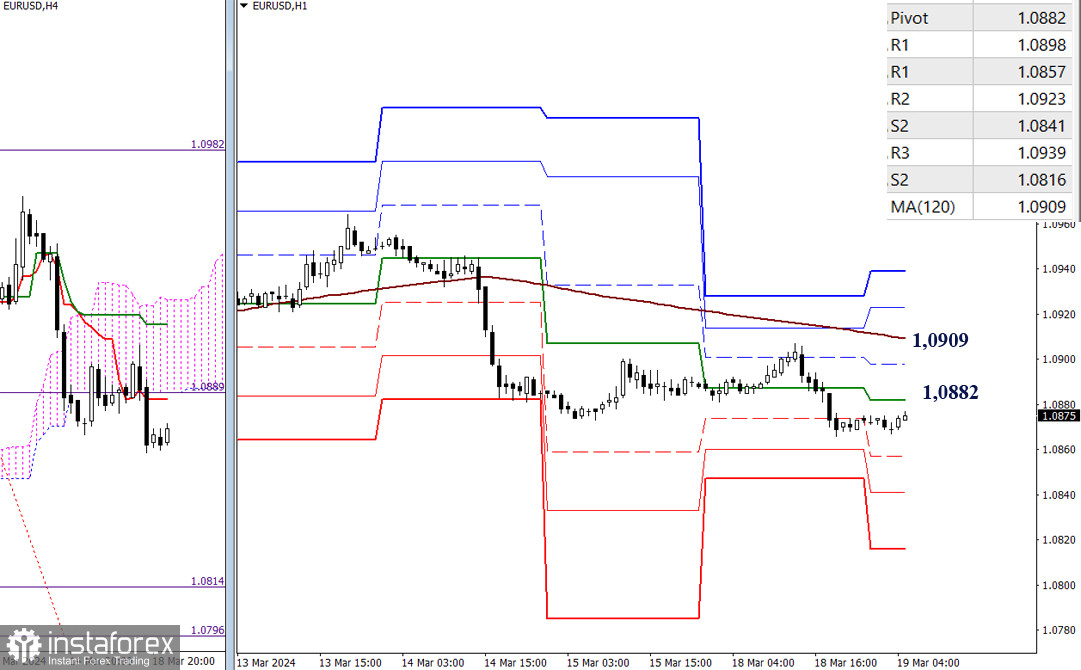
H4 - H1
On the lower timeframes, bears managed to strengthen their positions yesterday by updating the nearest low. Today, the reference points for intraday decline continue to be the support levels of the classic pivot points at 1.0857 - 1.0841 - 1.0816. Additionally, a new downward target has been formed for breaking the H4 cloud, with targets in the event of bearish sentiment development at 1.0814 - 1.0796.
The key levels of the lower timeframes now act as resistances, lying at the boundaries of 1.0882 (central pivot point of the day) - 1.0909 (weekly long-term trend). A breakthrough and consolidation above can alter the current balance of power, directing attention towards further strengthening of bullish sentiments.
***
GBP/USD
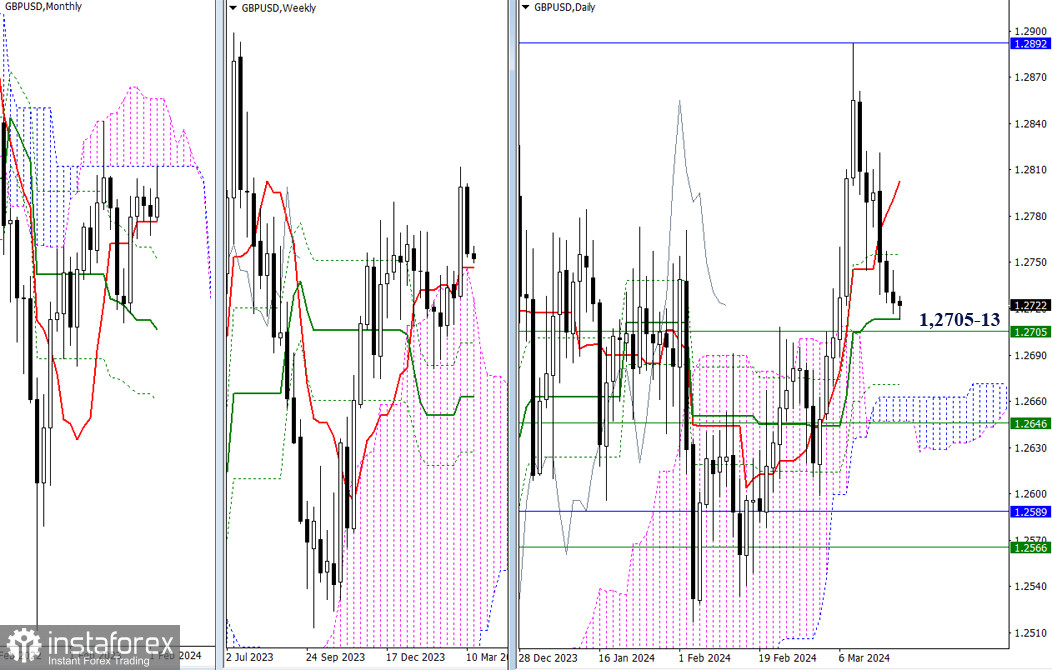
Higher Timeframes
The pair has slowly descended towards the supports of the daily medium-term trend (1.2713) and the weekly short-term trend (1.2705). For bears, breaking these supports is an important stage towards further decline. In the event of a change in priorities, a return to the market by buyers may contribute to the restoration of bullish positions, but the depth of the current decline is unlikely to be overcome quickly. The first obstacles for bulls will be the daily resistances at 1.2755 and 1.2803.
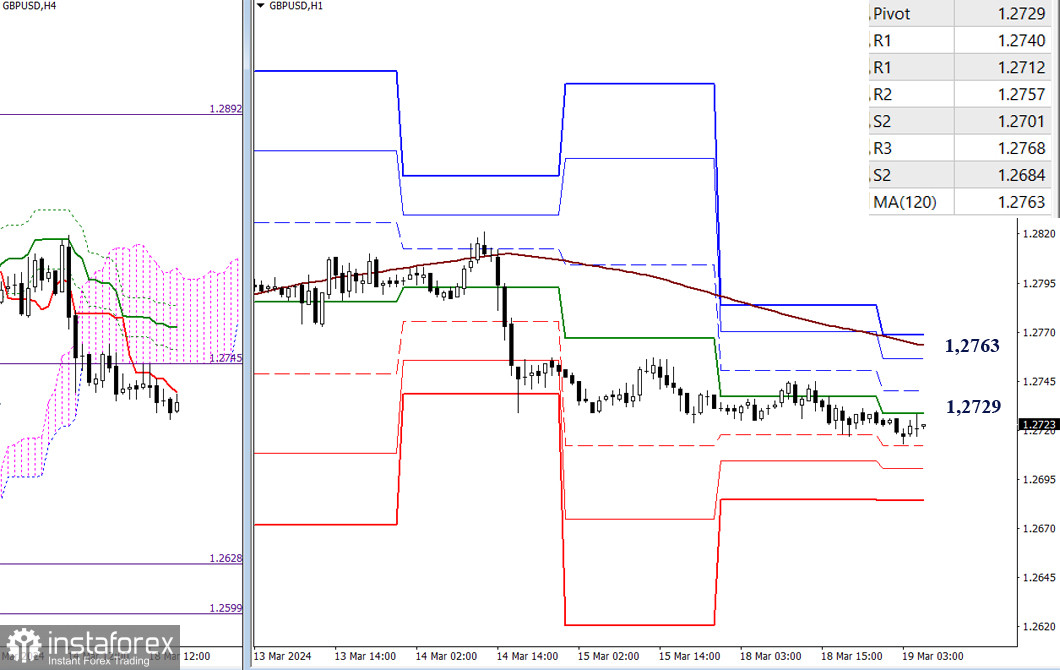
H4 - H1
On the lower timeframes, the main advantage continues to belong to bears as they persist in a slow descent. Today, the reference points for decline are the support levels of the classic pivot points (1.2712 - 1.2701 - 1.2684) and the downward target for breaking the H4 cloud (1.2688 - 1.2599). In the event of bullish activity, the recovery of positions by buyers under current conditions will pass through the key levels of the lower timeframes 1.2729 (central pivot point of the day) - 1.2763 (weekly long-term trend), with intermediate resistance possibly provided by the classic pivot points R1 (1.2740) and R2 (1.2757).
***
The technical analysis of the situation uses:
Higher timeframes - Ichimoku Kinko Hyo (9.26.52) + Fibonacci Kijun levels
Lower timeframes - H1 - Pivot Points (classic) + Moving Average 120 (weekly long-term trend)
*تعینات کیا مراد ہے مارکیٹ کے تجزیات یہاں ارسال کیے جاتے ہیں جس کا مقصد آپ کی بیداری بڑھانا ہے، لیکن تجارت کرنے کے لئے ہدایات دینا نہیں.
InstaSpot analytical reviews will make you fully aware of market trends! Being an InstaSpot client, you are provided with a large number of free services for efficient trading.


