


انسٹا فاریکس ٹیم میں لیجنڈ!
لیجنڈ!آپ کو لگتا ہے کہ یہ حیرت انگیز بیانات ہے؟ لیکن ہمیں ایسے شخص کو کیا کہنا چاہئے ، جو 18 سال میں جونیئر ورلڈ شطرنج چیمپئن شپ جیتنے والا پہلا ایشین بن گیا تھا اور 19 میں پہلا ہندوستانی گرینڈ ماسٹر بنا؟ ورلڈ چیمپیئن ٹائٹل کے لئے یہ مشکل آغاز تھا جو وشونااتھ آنند کے لئے تھا ، وہ شخص جو ہمیشہ کے لئے شطرنج کی تاریخ کا حصہ بن گیا تھا۔ انسٹا فاریکس ٹیم میں اب ایک اور لیجنڈ!


Borussia is one of the most titled football clubs in Germany, which has repeatedly proved to fans: the spirit of competition and leadership will certainly lead to success. Trade in the same way that sports professionals play the game: confidently and actively. Keep a "pass" from Borussia FC and be in the lead with InstaSpot!

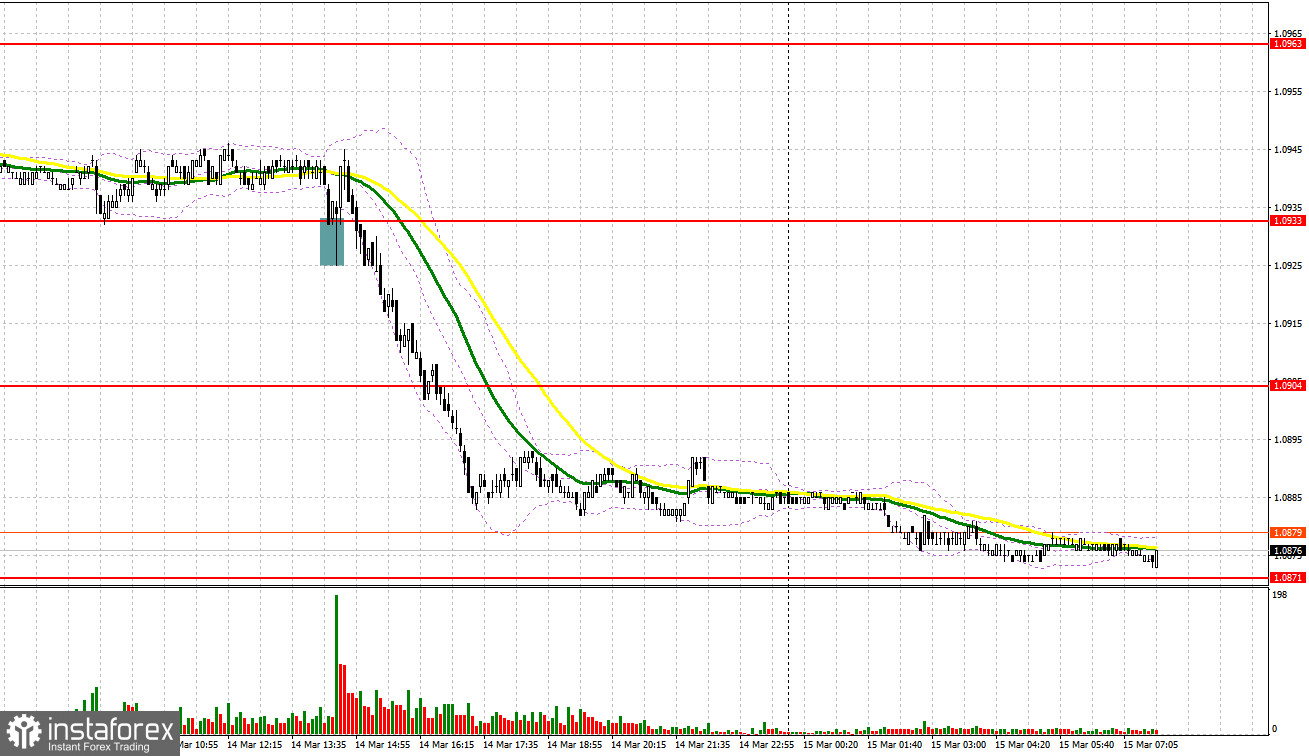
Yesterday, several market entry signals were generated to enter the market. Let's have a look at what happened on the 5-minute chart. In my morning review, I mentioned the level of 1.0933 as a possible entry point. The decrease and subsequent false breakout near 1.0933 triggered a buy signal, which sent the pair up by only 10 pips. In the afternoon, we got a similar entry point, but the pair did not actively rise, after which the euro sharply declined.
What is needed to open long positions on EUR/USD
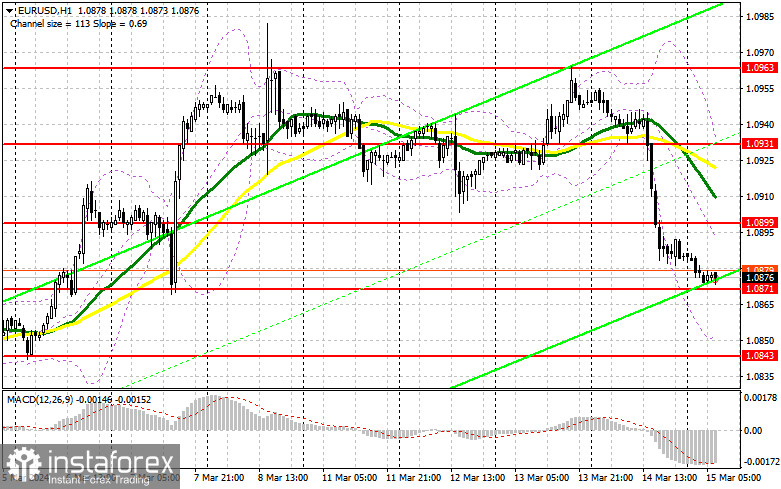
Strong reports on US retail sales and producer prices lifted the US dollar, as these reports support beliefs that the Federal Reserve may further push back its plans to lower interest rates. Persistent high inflationary pressures and a robust labor market have so far prevented monetary easing. Today, the Eurozone countries will publish a good number of secondary reports. The list includes the French and Italian Consumer Price Index, as well as retail sales and Italian foreign trade balance. The key event of the day will be the speech of European Central Bank Executive Board member Philip Lane. Considering how much the euro fell yesterday, my preferred strategy involves acting after a false breakout near the nearest support at 1.0871, where the pair is currently being traded. This will be a proper condition for buying in anticipation of a small correction to the area of 1.0899. A breakout and a downward test of this range, amid hawkish statements from the ECB official, will lead to strengthening the pair, giving a chance to buy during a climb to 1.0931, which is in line with the moving averages. The farthest target will be the 1.0963 high, where I will take profit. If EUR/USD declines and there is no activity around 1.0843, the selling pressure on the euro will increase, which will lead to a larger drop with the prospect of testing 1.0843. I plan to enter the market there only after a false breakout has formed. I will open long positions immediately on a rebound from 1.0800, bearing in mind an upward correction of 30-35 pips within the day.
What is needed to open short positions on EUR/USD
The bears are active today, which may trigger a major selloff during the European session. However, I would prefer to act only after a small correction and unsuccessful consolidation above 1.0899. This will be a suitable condition for selling with the prospect of testing 1.0871. Therefore, a breakout and consolidation below this range, as well as an upward retest, will provide another selling point during a slide of the price to 1.0843, where buyers will become more active. The farthest target will be the 1.0800 low, where I will take profit. If EUR/USD moves up in the first half of the day, and the bears do not show up at 1.0899, buyers will get a chance to compensate for yesterday's decline. In this case, I will postpone selling until the test of the next resistance at 1.0931. I will also sell there, but only after an unsuccessful consolidation. I plan to open short positions immediately on a rebound from 1.0963, bearing in mind a downward correction of 30-35 pips.
COT report:
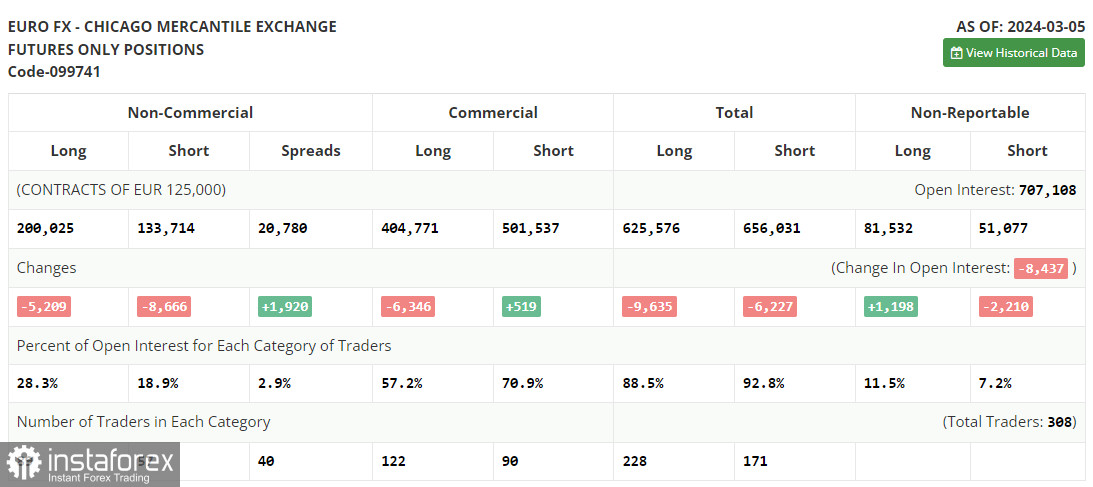
The March 5 COT report showed a reduction in both long and short positions. Neither the European Central Bank meeting outcomes nor the US labor market data sprung any surprises on traders, maintaining the momentum for risk asset buyers. However, the upcoming inflation data from the eurozone and the US could be pivotal. A downtrend in US inflation may herald new monthly highs for the European currency. The COT report revealed a decline in non-commercial long positions by 5,209 to 200,025, whereas non-commercial short positions fell by 8,666 to 133,714, expanding the spread between long and short positions by 1,920.
Indicators' signals
Moving averages
Trading below the 30- and 50-day moving averages indicates a possible decline in the pair.
Note: The period and prices of the moving averages are considered by the analyst on the 1-hour chart and differ from the general definition of classic daily moving averages on the daily chart.
Bollinger Bands
In case EUR/USD goes down, the indicator's lower border near 1.0855 will act as support.
Description of indicators
*تعینات کیا مراد ہے مارکیٹ کے تجزیات یہاں ارسال کیے جاتے ہیں جس کا مقصد آپ کی بیداری بڑھانا ہے، لیکن تجارت کرنے کے لئے ہدایات دینا نہیں.
InstaSpot analytical reviews will make you fully aware of market trends! Being an InstaSpot client, you are provided with a large number of free services for efficient trading.


