


EUR/USD
Analysis:
The price movement of the common European currency in its main pair has been defined by a descending wave since mid-July. On the daily chart, this segment represents a correction of the previous trend ascent. The wave structure still needs to be completed at the time of the analysis. Since the beginning of October, the middle part (B) has been developing.
Forecast:
The beginning of the upcoming week is expected to see a continuation of the upward movement of the euro up to the resistance zone. Activation and the start of a decline in the exchange rate can be expected in the second half. The nearest support will limit the weekly course of the pair but will be a manageable barrier.
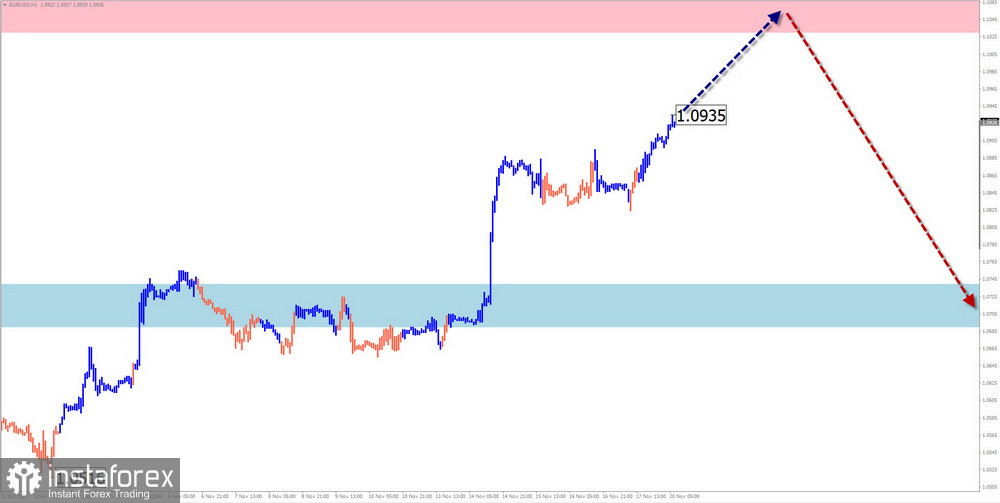
Potential Reversal Zones
Resistance:
Support:
Recommendations:
Selling: Sales can be considered after the appearance of corresponding signals in the support zone for trading deals.
Buying: Fractional lots can be considered within intraday trading.
USD/JPY
Analysis:
Since mid-summer, the quotes of the main pair of the Japanese yen have formed an ascending wave on the chart, which still needs to be completed. Since the end of October, quotes in the flat have formed an opposite descending extended flat. The wave has entered the final phase. The calculated support is within the potential reversal zone of the daily TF.
Forecast:
The price will exert pressure on the support zone in the next couple of days. Further, there is a high probability of a reversal and a resumption of the upward course. A breakthrough above the calculated resistance during the current week is unlikely.
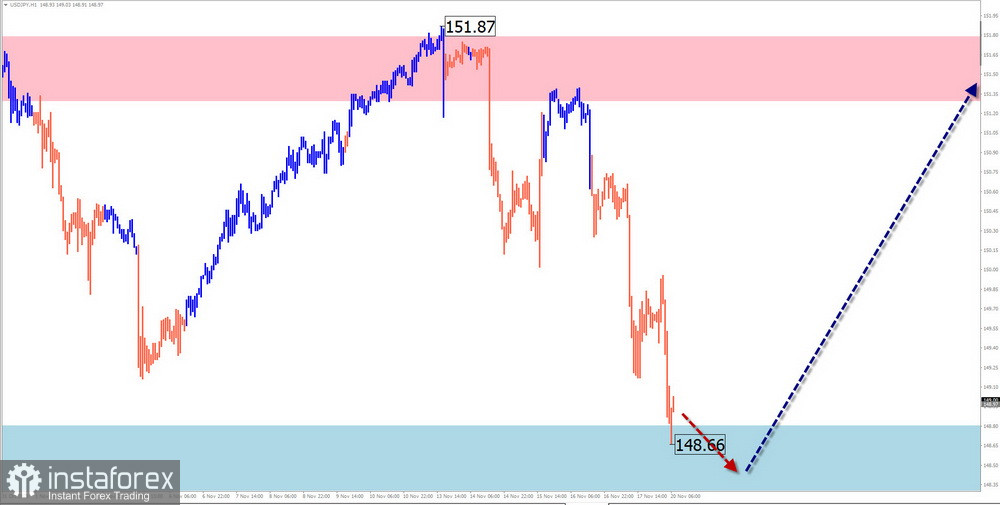
Potential Reversal Zones
Resistance:
Support:
Recommendations:
Buying: Will become relevant after the appearance of reversal signals in your TS in the support area.
Selling: Deals can be used with fractional lots within individual sessions.
GBP/JPY
Analysis:
The direction of movement of the short-term trend of the British pound/Japanese yen cross is still defined by an ascending wave since July 28. Since the end of August, the price along a powerful resistance zone formed a corrective part of the wave (B). Its structure at the time of the analysis does not show completeness.
Forecast:
Throughout the upcoming week, the completion of the upward course of movement in the resistance zone is expected, followed by a reversal and a repeated decline in price to the support zone. A breakthrough in price beyond the calculated zones during the current week is unlikely.
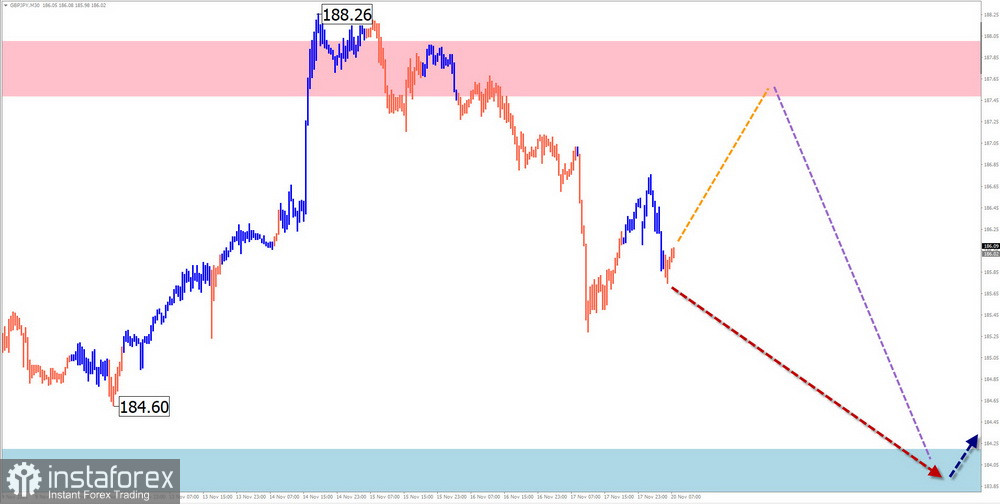
Potential Reversal Zones
Resistance:
Support:
Recommendations:
Buying: This will be possible with fractional lots within individual sessions with the potential up to the resistance zone.
Selling: This will become relevant after the appearance in the resistance zone of signals confirmed by your trading systems of a reversal.
USD/CAD
Analysis:
The algorithm of the bull wave determines the direction of the short-term trend of the major Canadian dollar since July 14. The structure of this wave at the time of the analysis still needs to be completed. Since the beginning of October, quotes have formed a correction in the form of a horizontal plane. After its completion, the course of the pair will continue to rise.
Forecast:
At the beginning of the upcoming week, a continuation of the downward vector of the price movement is expected. The decline and reversal completion are likely within the calculated support. By the end of the week, the probability of an increase in volatility and a resumption of the upward direction of the price movement increases.
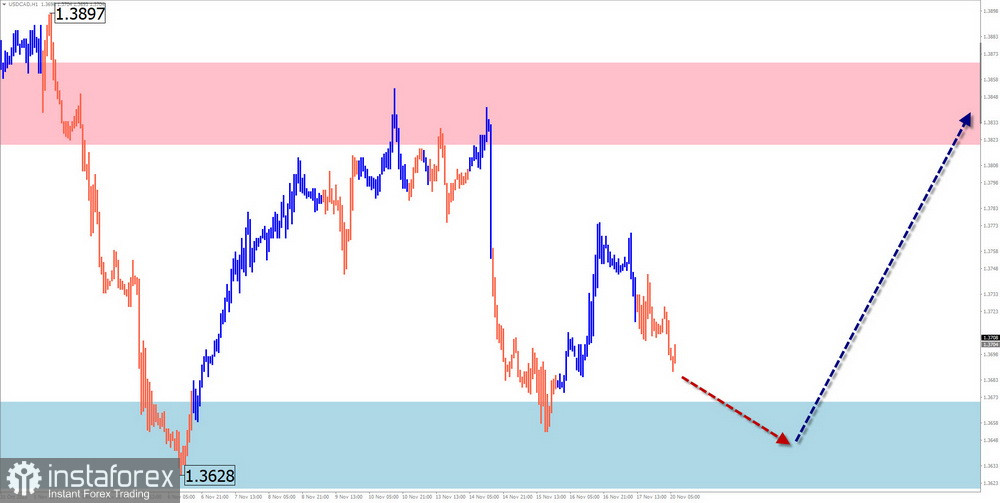
Potential Reversal Zones
Resistance:
Support:
Recommendations:
Buying: This will become relevant after the reversal signals on your used trading systems are confirmed.
Selling: Have low potential and can be risky.
NZD/USD
Analysis:
The fluctuations of the New Zealand dollar from December of last year fit into the algorithms of the descending wave. Quotes have reached the upper boundary of the powerful support zone of the daily TF. However, the wave structure does not indicate completeness. Since the end of October, quotes form a completion of the ascending retracement.
Week Forecast:
At the beginning of the upcoming week, you can expect a slightly ascending vector of movement, with quotes rising no higher than the calculated resistance. A change in direction is more likely in the second half of the week. The greatest activity can be associated with the time of release of important economic news.
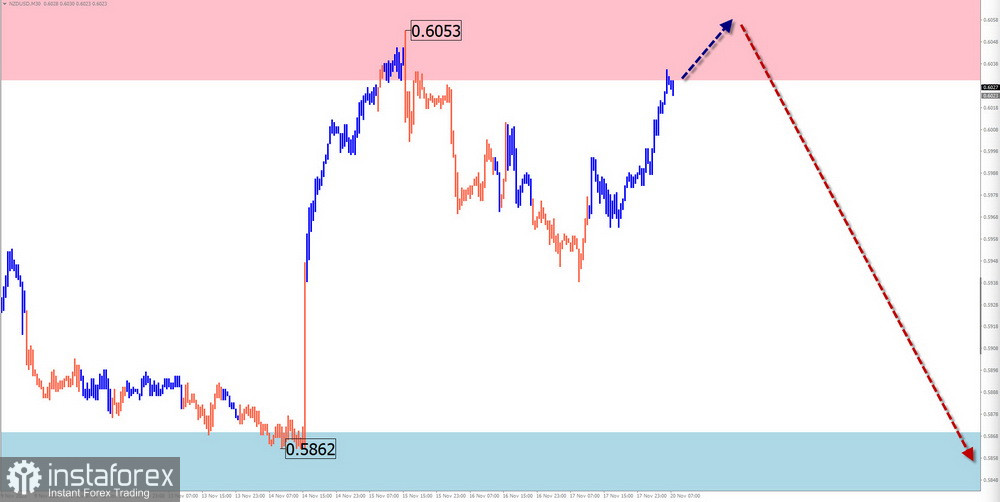
Potential Reversal Zones
Resistance:
Support:
Recommendations:
Buying: Allowed with reduced lots within individual sessions. The potential is limited by resistance.
Selling: Can be considered for trading deals only after the appearance of corresponding reversal signals in the resistance area.
Gold
Analysis:
An ascending wave zigzag from October 3 determines the direction of the price movement of gold in the short term. This wave begins a new section of the dominant trend on the daily chart. Quotes are at the lower boundary of the potential reversal zone of the large TF. Since the end of October, the price has been corrected in a sideways flat.
Forecast:
The rise in quotes may continue in the next couple of days. Pressure on the resistance zone is not excluded until a short-term puncture of its upper boundary. After that, expect sideways drift, with conditions for resuming the downward trend. An increase in volatility and a decrease in the course of the instrument can be expected closer to the weekend.
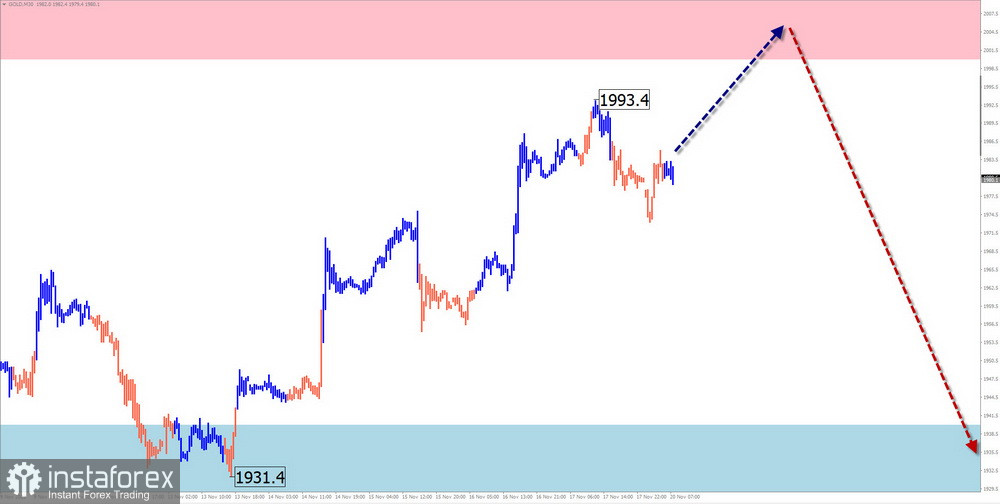
Potential Reversal Zones
Resistance:
Support:
Recommendations:
Selling: Will be possible after the appearance in the support zone of confirmed reversal signals. The potential for transactions is limited by resistance.
Buying: Due to the small potential, it can be risky.
Explanations: In simplified wave analysis (SWA), all waves consist of 3 parts (A-B-C). On each TF, the latest, unfinished wave is analyzed. Dashed lines indicate expected movements.
Attention: The wave algorithm does not consider the duration of movements of instruments over time!
*تعینات کیا مراد ہے مارکیٹ کے تجزیات یہاں ارسال کیے جاتے ہیں جس کا مقصد آپ کی بیداری بڑھانا ہے، لیکن تجارت کرنے کے لئے ہدایات دینا نہیں.
InstaSpot analytical reviews will make you fully aware of market trends! Being an InstaSpot client, you are provided with a large number of free services for efficient trading.


