


ہمارے ٹیم میں 7000000 سے ذائد تاجران شامل ہیں
ہم تجارت کی بہتری کے لئے ہر روز اکھٹے کام کرتے ہیں اور بہترین نتائج حاصل کرتے ہوئے آگے کی جانب بڑھتے ہیں
دُنیا بھر سے سے لاکھوں ہمارے بہترین کام کو سند عطاء کرتے ہیں آپ اپنا انتحاب کریں باقی ہم آپ کی توقعات پر پورا اترنے کے لئے اپنی بہترین کوشش کریں گے
ہم مل کر ایک بہترین ٹیم بناتے ہیں
انسٹا فاریکس آپ سے کام کرتے ہوئے فخر محسوس کرتا ہے


ایکٹر - یو سی ایف 6 ٹورنامنٹ چیمپین اور واقعی ہیرو
ایک فرد کے جس نے اپنا آپ منوایا ہے وہ فرد کہ جو ہماری راہ پر چلا ہے.
ٹکٹا روو کی کامیابی کا راز یہ ہے کہ وہ اپنے اہداف کی جانب مسلسل بڑھتا رہتا ہے
اپنے ہنر یا ٹیلنٹ کے تمام پہلو آشکار کررہے ہیں
پہچانیں ، کوشش کریں ، ناکام ہوں لیکن کبھی نہ رُکیں
انسٹا فاریکس آپ کی کامیابی کی کہاں یہاں سے شروع ہوتی ہے

In conjunction with Fed Chairman Jerome Powell's firm statements, the fall in the American stock market and the decline in U.S. government bond yields provided additional support to the dollar on Thursday.
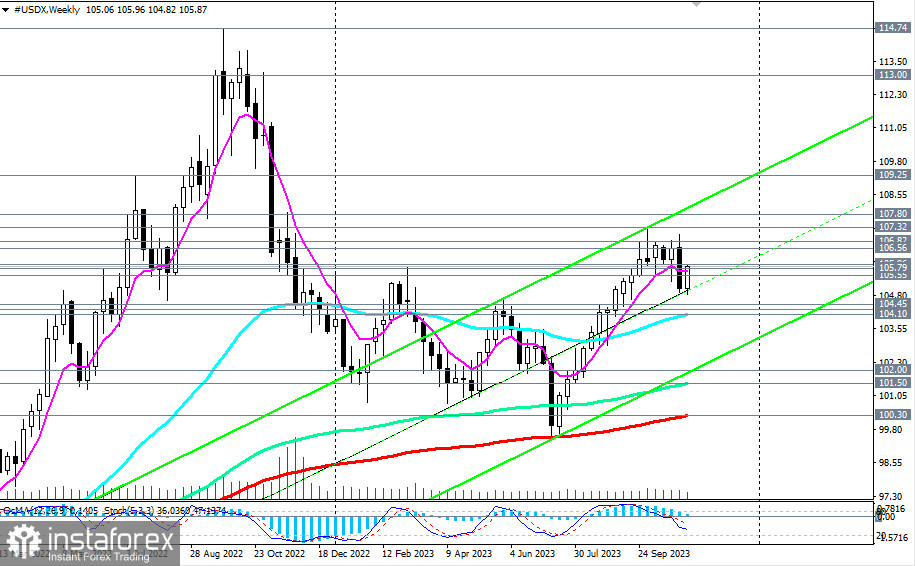
As of this writing, the DXY index was near the level of 105.78, slightly below yesterday's high of 105.83. The dollar index (CFD #USDX on the MT4 terminal) is developing an upward trend within the bull trend, medium-term—above the key support level of 104.25 (200 EMA on the daily chart), separating the medium-term bull market from the bearish one, long-term—above the key support level of 100.30 (200 EMA on the weekly chart).

The breakout of today's local high of 105.96 could signal an increase in long positions on the dollar index with the prospect of growth to local resistance levels of 106.56, 106.82, 107.05, and 107.32. In any case, long positions remain preferable for now.
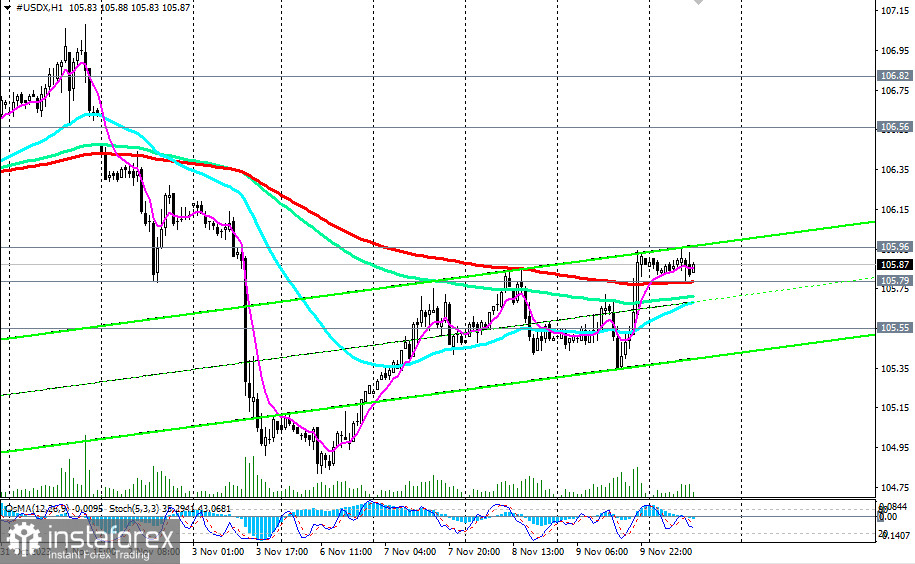
In an alternative scenario, a signal to open short positions could be the breakdown of important short-term support levels at 105.79 (200 EMA on the 1-hour chart) and 105.68 (200 EMA on the 15-minute chart) with the prospect of a corrective decline to the important support level of 105.55 (50 EMA on the daily chart). However, its breakdown may trigger a deeper correction, down to key support levels of 104.45 (144 EMA on the daily chart) and 104.25 (200 EMA on the daily chart).
Support levels: 105.79, 105.68, 105.55, 105.00, 104.45, 104.25, 104.10, 103.00, 102.00, 101.50, 101.00, 100.30, 100.00
Resistance levels: 105.96, 106.00, 106.56, 106.82, 107.00, 107.32, 107.80, 108.00, 109.00, 109.25
*تعینات کیا مراد ہے مارکیٹ کے تجزیات یہاں ارسال کیے جاتے ہیں جس کا مقصد آپ کی بیداری بڑھانا ہے، لیکن تجارت کرنے کے لئے ہدایات دینا نہیں.
InstaSpot analytical reviews will make you fully aware of market trends! Being an InstaSpot client, you are provided with a large number of free services for efficient trading.


