


ہمارے ٹیم میں 7000000 سے ذائد تاجران شامل ہیں
ہم تجارت کی بہتری کے لئے ہر روز اکھٹے کام کرتے ہیں اور بہترین نتائج حاصل کرتے ہوئے آگے کی جانب بڑھتے ہیں
دُنیا بھر سے سے لاکھوں ہمارے بہترین کام کو سند عطاء کرتے ہیں آپ اپنا انتحاب کریں باقی ہم آپ کی توقعات پر پورا اترنے کے لئے اپنی بہترین کوشش کریں گے
ہم مل کر ایک بہترین ٹیم بناتے ہیں
انسٹا فاریکس آپ سے کام کرتے ہوئے فخر محسوس کرتا ہے


ایکٹر - یو سی ایف 6 ٹورنامنٹ چیمپین اور واقعی ہیرو
ایک فرد کے جس نے اپنا آپ منوایا ہے وہ فرد کہ جو ہماری راہ پر چلا ہے.
ٹکٹا روو کی کامیابی کا راز یہ ہے کہ وہ اپنے اہداف کی جانب مسلسل بڑھتا رہتا ہے
اپنے ہنر یا ٹیلنٹ کے تمام پہلو آشکار کررہے ہیں
پہچانیں ، کوشش کریں ، ناکام ہوں لیکن کبھی نہ رُکیں
انسٹا فاریکس آپ کی کامیابی کی کہاں یہاں سے شروع ہوتی ہے

The rate of decline in producer prices in the EU accelerated from -11.5% to -12.4%. These figures turned out to be slightly better than the forecast of -12.6%, but it doesn't change the essence of the situation. Inflation in the EU will continue to decrease at a rapid pace. This means that the ECB interest rates will no longer rise and are expected to decline.
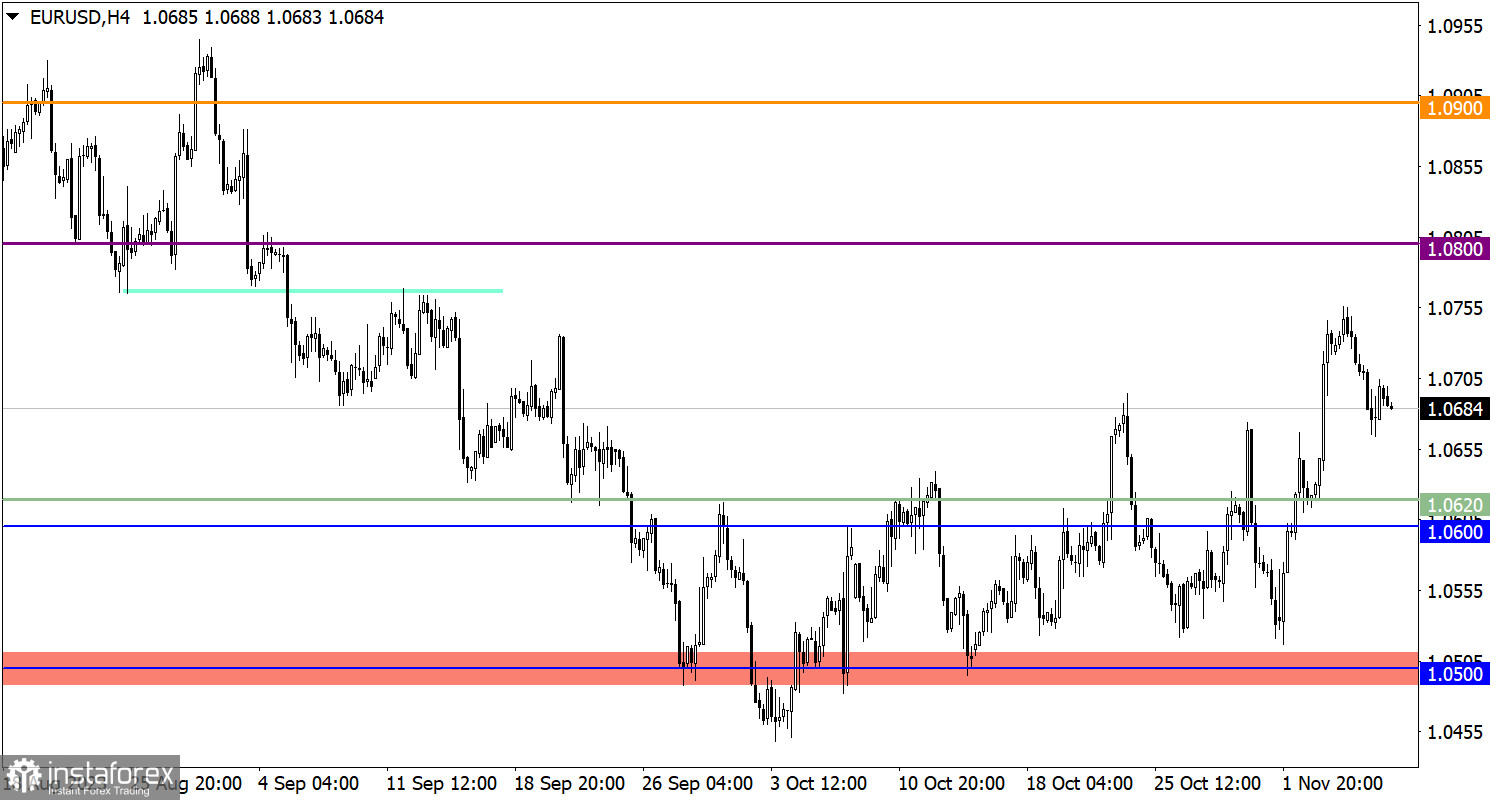
The EUR/USD currency pair continues to follow a downward trend set from the 1.0750 level.
During a technical pullback from the 1.2400 level, GBP/USD dropped to 1.2270. This movement resulted in a partial recovery of the dollar positions.

Today, the publication of retail sales data in the EU is expected, and the pace of decline may accelerate from -2.1% to -2.8%. If the data is confirmed or turns out worse than expected, the euro exchange rate will decline, dragging the British pound down with it.
In the event of a further weakening of the euro, a drop to the 1.0620 level is possible. As for the bullish scenario, the quote needs to return to the 1.0750 level first, indicating a possible increase in the volume of long positions in the euro.
In the case of price stabilization below 1.2270, a subsequent increase in the volume of short positions is possible. In this scenario, the British pound will continue to decline towards the 1.2200 level.
As for the bullish scenario, it will be considered by traders if sellers fail to stay below 1.2270, and this level is played as support.
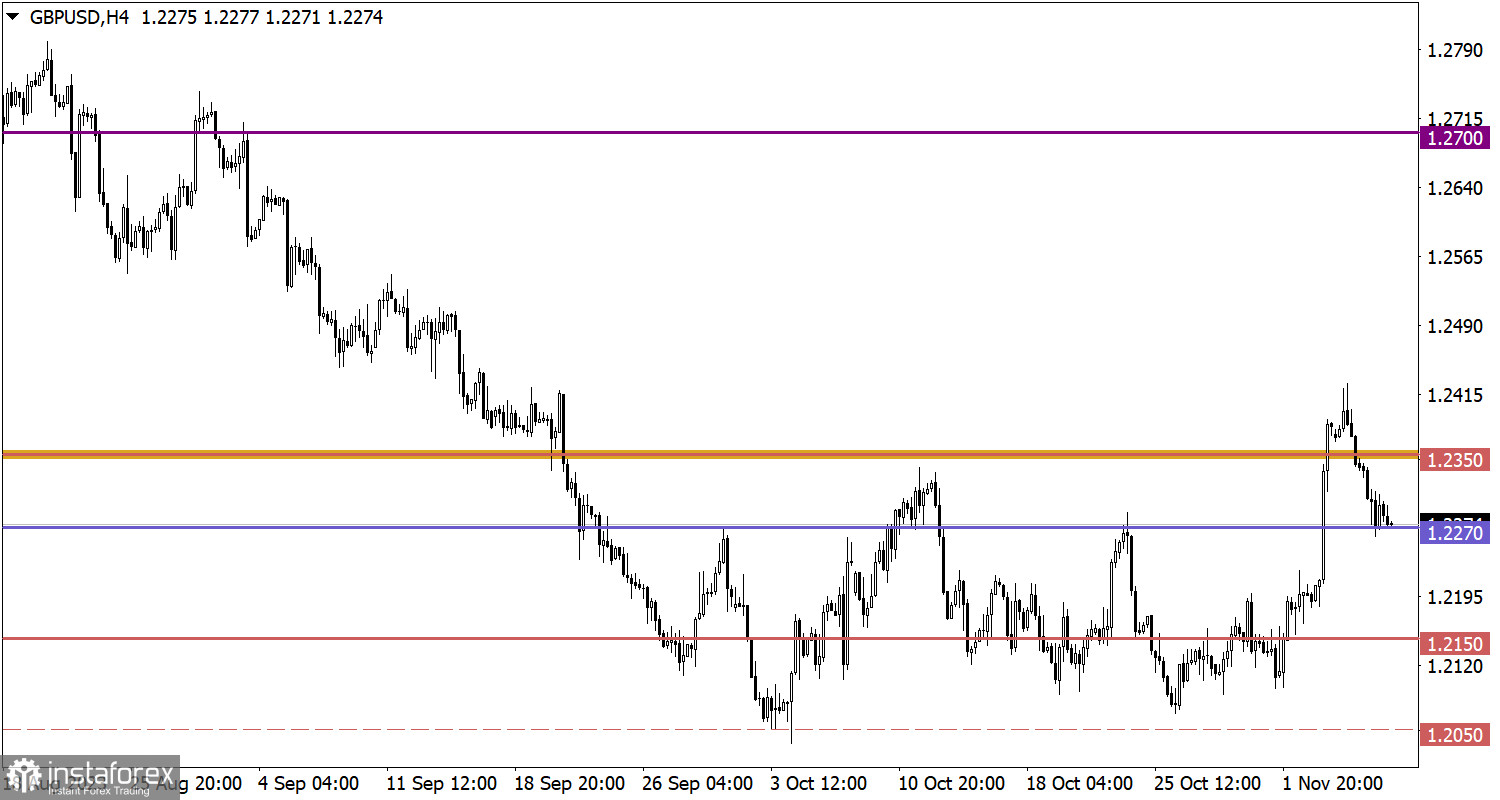
The candlestick chart type is white and black graphic rectangles with lines above and below. With a detailed analysis of each individual candle, you can see its characteristics relative to a particular time frame: opening price, closing price, intraday high and low.
Horizontal levels are price coordinates, relative to which a price may stop or reverse its trajectory. In the market, these levels are called support and resistance.
Circles and rectangles are highlighted examples where the price reversed in history. This color highlighting indicates horizontal lines that may put pressure on the asset's price in the future.
The up/down arrows are landmarks of the possible price direction in the future.
*تعینات کیا مراد ہے مارکیٹ کے تجزیات یہاں ارسال کیے جاتے ہیں جس کا مقصد آپ کی بیداری بڑھانا ہے، لیکن تجارت کرنے کے لئے ہدایات دینا نہیں.
InstaSpot analytical reviews will make you fully aware of market trends! Being an InstaSpot client, you are provided with a large number of free services for efficient trading.


