


انسٹا فاریکس ٹیم میں لیجنڈ!
لیجنڈ!آپ کو لگتا ہے کہ یہ حیرت انگیز بیانات ہے؟ لیکن ہمیں ایسے شخص کو کیا کہنا چاہئے ، جو 18 سال میں جونیئر ورلڈ شطرنج چیمپئن شپ جیتنے والا پہلا ایشین بن گیا تھا اور 19 میں پہلا ہندوستانی گرینڈ ماسٹر بنا؟ ورلڈ چیمپیئن ٹائٹل کے لئے یہ مشکل آغاز تھا جو وشونااتھ آنند کے لئے تھا ، وہ شخص جو ہمیشہ کے لئے شطرنج کی تاریخ کا حصہ بن گیا تھا۔ انسٹا فاریکس ٹیم میں اب ایک اور لیجنڈ!


Borussia is one of the most titled football clubs in Germany, which has repeatedly proved to fans: the spirit of competition and leadership will certainly lead to success. Trade in the same way that sports professionals play the game: confidently and actively. Keep a "pass" from Borussia FC and be in the lead with InstaSpot!

Monday, as usual, was accompanied by an empty macroeconomic calendar. Important statistical data were not released in the European Union, the United Kingdom, and the United States.
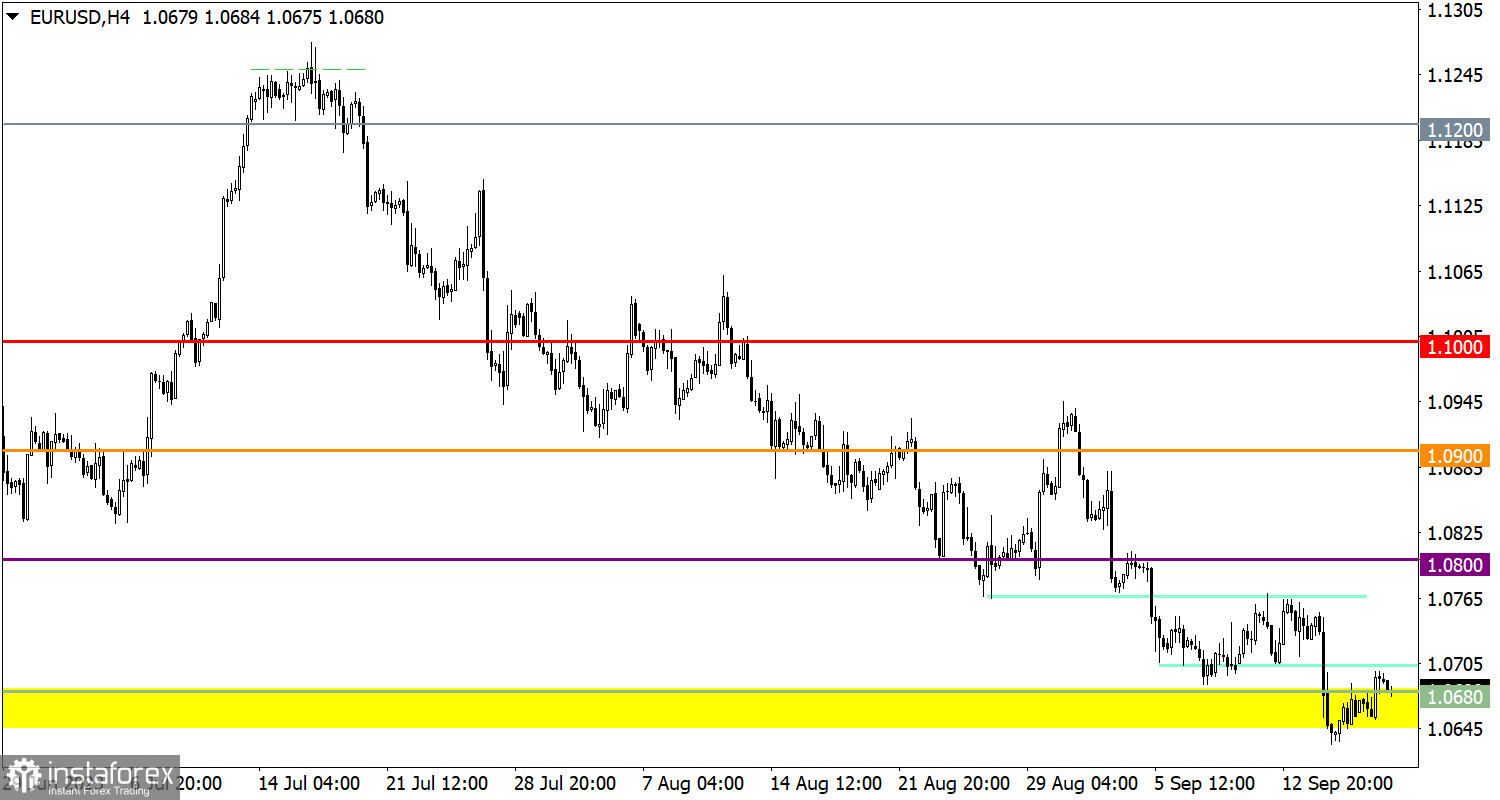
The EUR/USD currency pair slightly strengthened during the price pullback, but no radical changes occurred.
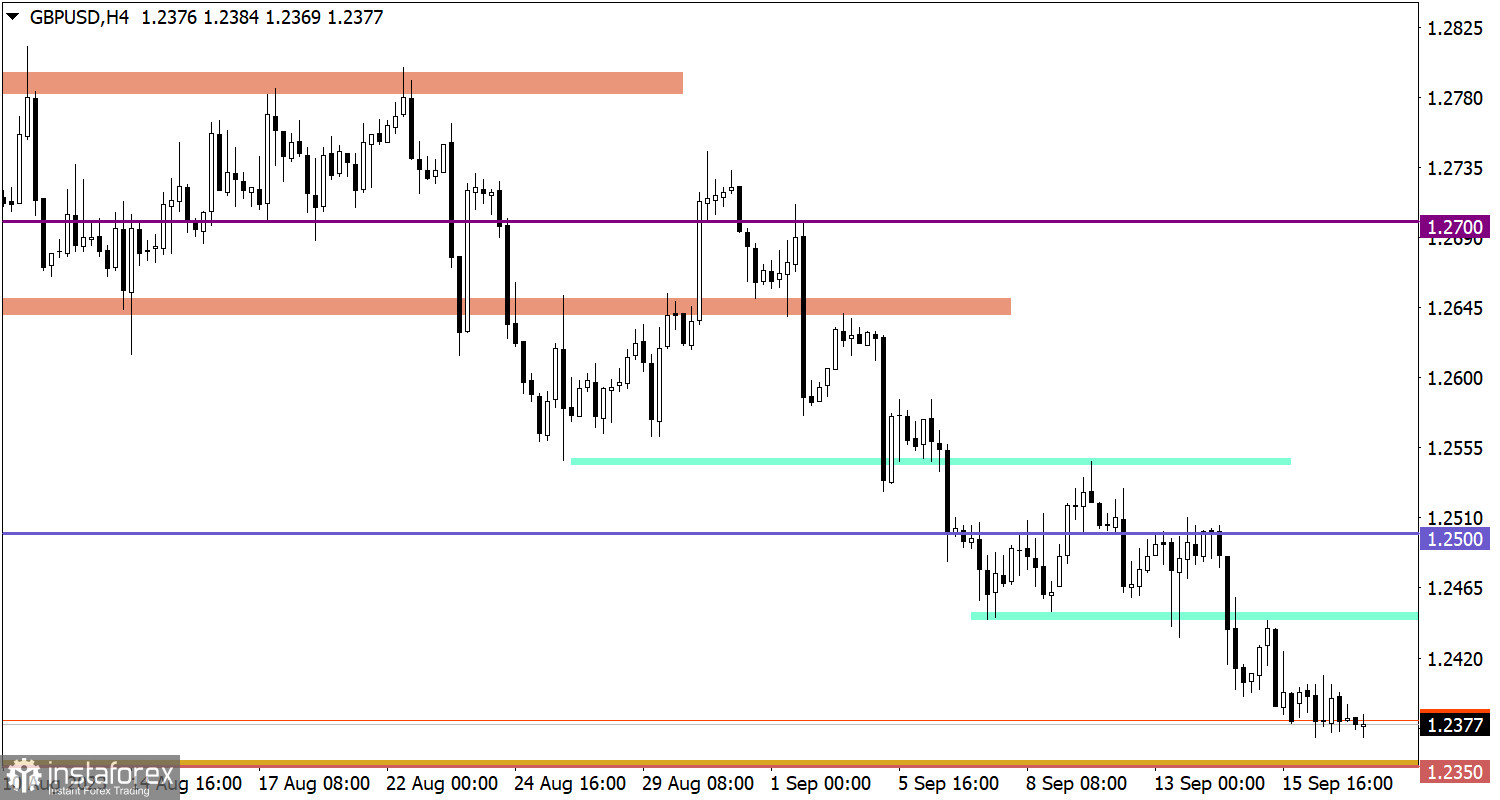
The GBP/USD pair formed a stagnation zone near the base of the downward trend. This price move indicated traders' prevailing interest in short positions, despite the clear oversold signal for the pound sterling.
Today, data on inflation in the EU is expected to be published. However, since these are final figures, market reaction is unlikely unless they deviate significantly from the preliminary estimate.
To initiate the primary stage of the euro's recovery, it is necessary to first ensure that the price remains above the level of 1.0700. In that case, there is a potential for strengthening long-term positions with a target of reaching the level of 1.0750.
Regarding a more negative scenario, for the continuation of the current decline, it is sufficient for the price to remain below the level of 1.0650, which would increase the chances for sellers of further decline.
The current period of stagnation may serve as a temporary pause for regrouping forces in the market, and speculative price movements may occur after its completion. In case of further decline, sellers should pay attention to the support level in the range of 1.2300/1.2350, within which a reduction in short positions may occur. This could lead to a partial recovery of the pound's exchange rate.
However, a technical signal for the continuation of the downward cycle, along with signs of changes in medium-term interests, may emerge if the price remains below the level of 1.2300 during the daily period.
The candlestick chart type is white and black graphic rectangles with lines above and below. With a detailed analysis of each individual candle, you can see its characteristics relative to a particular time frame: opening price, closing price, intraday high and low.
Horizontal levels are price coordinates, relative to which a price may stop or reverse its trajectory. In the market, these levels are called support and resistance.
Circles and rectangles are highlighted examples where the price reversed in history. This color highlighting indicates horizontal lines that may put pressure on the asset's price in the future.
The up/down arrows are landmarks of the possible price direction in the future.
*تعینات کیا مراد ہے مارکیٹ کے تجزیات یہاں ارسال کیے جاتے ہیں جس کا مقصد آپ کی بیداری بڑھانا ہے، لیکن تجارت کرنے کے لئے ہدایات دینا نہیں.
InstaSpot analytical reviews will make you fully aware of market trends! Being an InstaSpot client, you are provided with a large number of free services for efficient trading.


