


ہمارے ٹیم میں 7000000 سے ذائد تاجران شامل ہیں
ہم تجارت کی بہتری کے لئے ہر روز اکھٹے کام کرتے ہیں اور بہترین نتائج حاصل کرتے ہوئے آگے کی جانب بڑھتے ہیں
دُنیا بھر سے سے لاکھوں ہمارے بہترین کام کو سند عطاء کرتے ہیں آپ اپنا انتحاب کریں باقی ہم آپ کی توقعات پر پورا اترنے کے لئے اپنی بہترین کوشش کریں گے
ہم مل کر ایک بہترین ٹیم بناتے ہیں
انسٹا فاریکس آپ سے کام کرتے ہوئے فخر محسوس کرتا ہے


ایکٹر - یو سی ایف 6 ٹورنامنٹ چیمپین اور واقعی ہیرو
ایک فرد کے جس نے اپنا آپ منوایا ہے وہ فرد کہ جو ہماری راہ پر چلا ہے.
ٹکٹا روو کی کامیابی کا راز یہ ہے کہ وہ اپنے اہداف کی جانب مسلسل بڑھتا رہتا ہے
اپنے ہنر یا ٹیلنٹ کے تمام پہلو آشکار کررہے ہیں
پہچانیں ، کوشش کریں ، ناکام ہوں لیکن کبھی نہ رُکیں
انسٹا فاریکس آپ کی کامیابی کی کہاں یہاں سے شروع ہوتی ہے

Crypto Industry News:
Bitcoin price is rising. It increased by over 5% on a weekly basis. One classic on-chain indicator suggests that the cryptocurrency's peak this cycle could be at least $110,000.
It's about the so-called Terminal Price. This is a key metric that is calculated by dividing Coin Days Destroyed (CDD) by the existing supply. CDD measures the number of days BTC has been dormant each time a certain amount of coins moves on the chain, serving as an indicator of hodler intent and activity. Created by Philip Swift, Principal Analyst at Glassnode, Terminal Price helps you determine ATH for a given cycle.
During the bull market in 2017 and in April 2021, the bitcoin price hit the Terminal Price trend line. Swift suggests that selling "close to" the final price may be a wise strategy.
According to the model, during the current cycle ATH may amount to USD 110,000, and the bull market is expected to end at the end of 2025. At the same time, however, it is worth adding that due to the fact that the Terminal Price increases over time, USD 110,000 for 1 BTC may show careful respect.
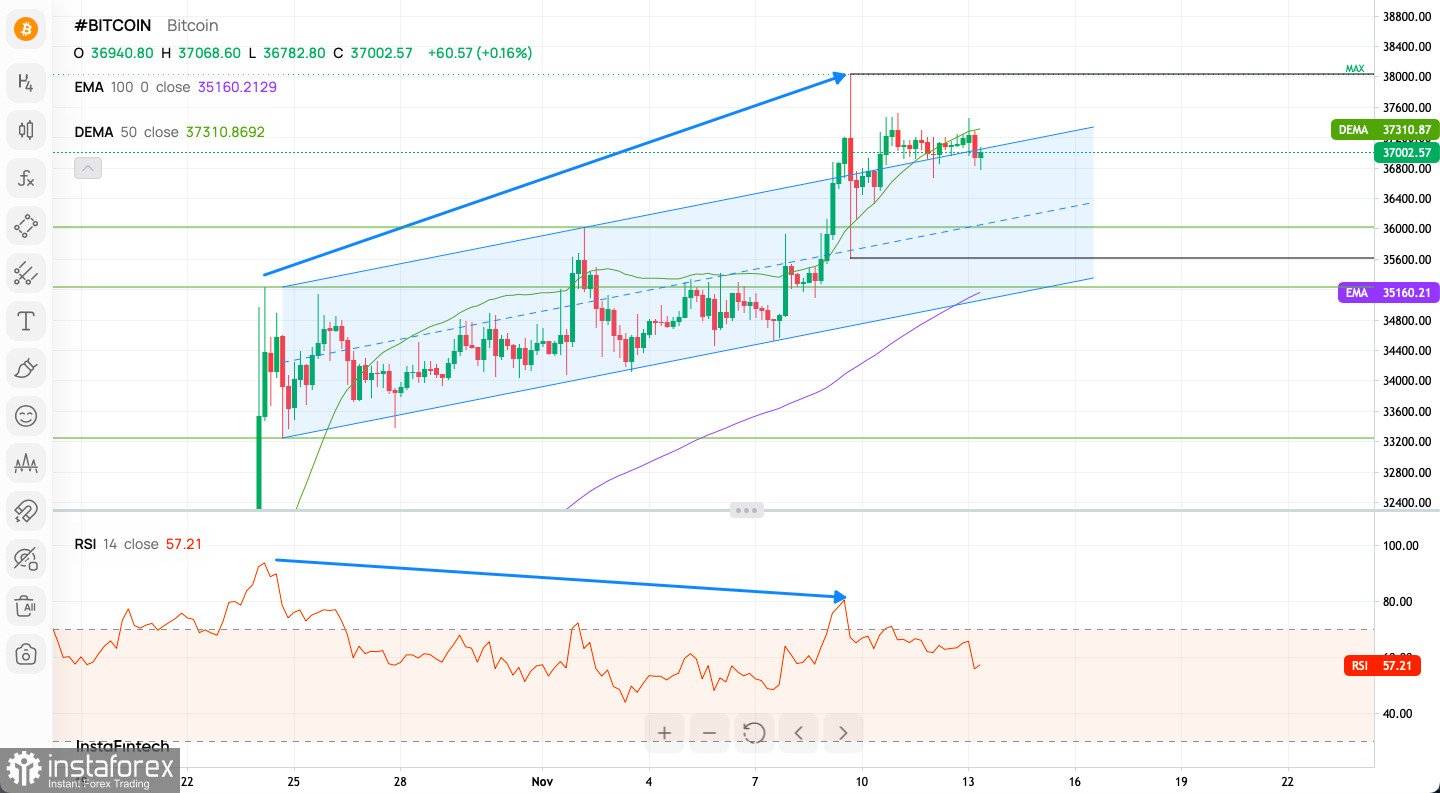
Technical Market Outlook:
The BTC/USD pair has made a new swing high at the level of $38,027 as the bulls are in control of the market. The price is again coming off the extremely overbought conditions on the H4 time frame chart and now there is a clear Bearish Divergence between the price and the momentum on the H4 time-frame chart, so a pull-back is due soon. The intraday technical support is seen at $36,702, $36,400 and $36,782. The next target for bulls is seen at the level of $40,000, but first the last week high located at $37,889 must be violated. The momentum remains strong and positive, so after the pull-back for the last swing high is done, the up trend shall continue.
Weekly Pivot Points:
WR3 - $38,322
WR2 - $37,676
WR1 - $37,333
Weekly Pivot - $37,030
WS1 - $36,687
WS2 - $36,384
WS3 - $35,738
Trading Outlook:
The bulls broken above the gamechanging level located at $25,442, so now the mid-term outlook for BTC is bullish. The next target for bulls is seen at the level of $40,000. As long as the level of 19,572 is not clearly violated, there is a chance for a long-term up trend to continue.
*تعینات کیا مراد ہے مارکیٹ کے تجزیات یہاں ارسال کیے جاتے ہیں جس کا مقصد آپ کی بیداری بڑھانا ہے، لیکن تجارت کرنے کے لئے ہدایات دینا نہیں.
InstaSpot analytical reviews will make you fully aware of market trends! Being an InstaSpot client, you are provided with a large number of free services for efficient trading.


