


انسٹا فاریکس ٹیم میں لیجنڈ!
لیجنڈ!آپ کو لگتا ہے کہ یہ حیرت انگیز بیانات ہے؟ لیکن ہمیں ایسے شخص کو کیا کہنا چاہئے ، جو 18 سال میں جونیئر ورلڈ شطرنج چیمپئن شپ جیتنے والا پہلا ایشین بن گیا تھا اور 19 میں پہلا ہندوستانی گرینڈ ماسٹر بنا؟ ورلڈ چیمپیئن ٹائٹل کے لئے یہ مشکل آغاز تھا جو وشونااتھ آنند کے لئے تھا ، وہ شخص جو ہمیشہ کے لئے شطرنج کی تاریخ کا حصہ بن گیا تھا۔ انسٹا فاریکس ٹیم میں اب ایک اور لیجنڈ!


Borussia is one of the most titled football clubs in Germany, which has repeatedly proved to fans: the spirit of competition and leadership will certainly lead to success. Trade in the same way that sports professionals play the game: confidently and actively. Keep a "pass" from Borussia FC and be in the lead with InstaSpot!

EUR/USD
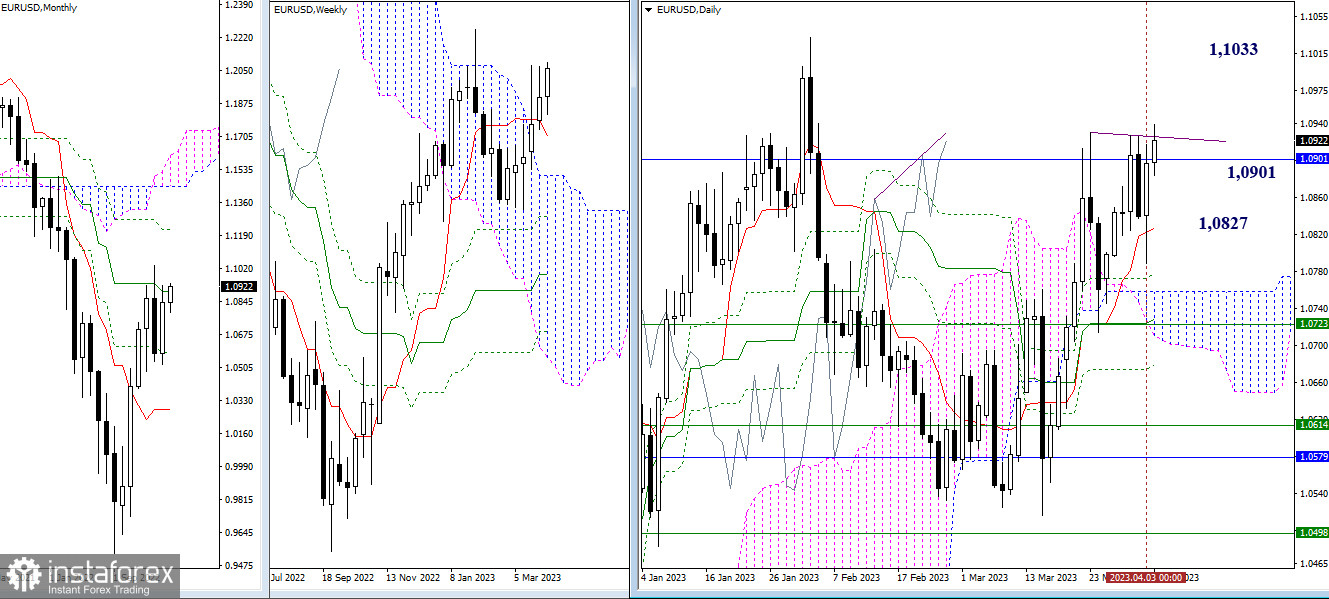
Higher time frames
Based on yesterday's results, we can see that the sentiment has changed again. The bulls showed activity and brought the pair back under the monthly medium-term trend (1.0901). Today, the high of the last few weeks (1.0930) has been retested, and a claim for a further rise has been made. If the buyers manage to hold their positions and continue moving, their next target is seen at 1.1033 (the maximum extremum of February). If there is another change in the market sentiment, and the bulls fail to hold at 1.0901, attention will again be focused on the daily short-term trend (1.0827) and the subsequent support at 1.0772-58.
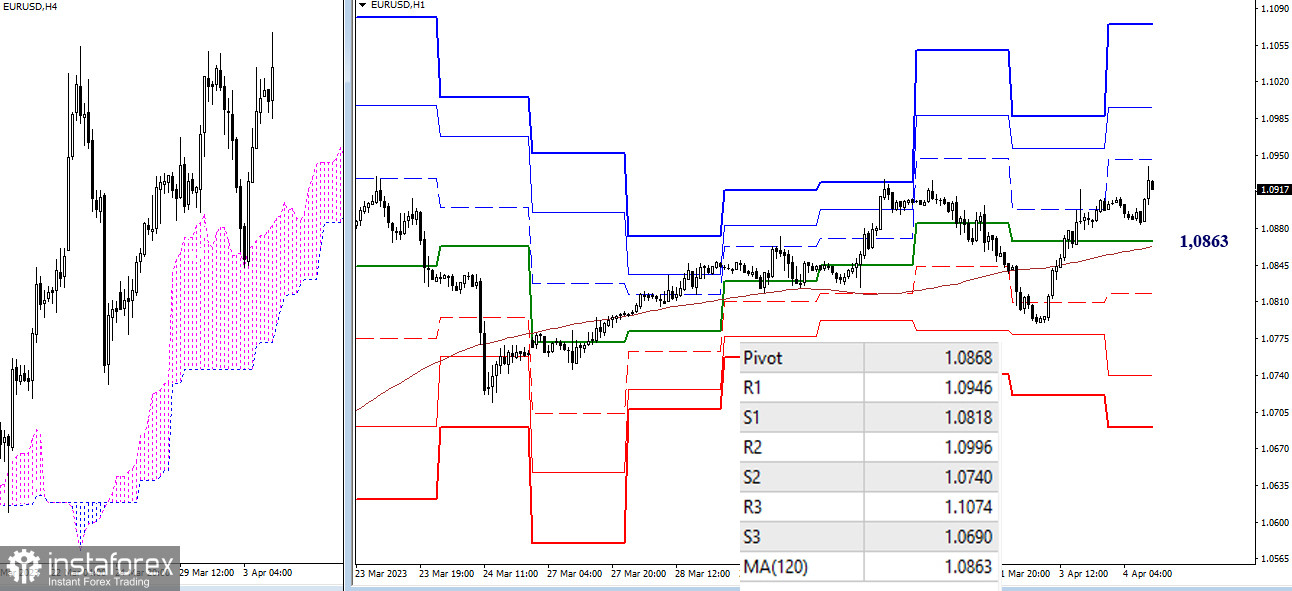
H4 – H1
Instead of performing a retest, bears lost control of the key levels yesterday. So today, on shorter time intervals, the main advantage belongs to the buyers who are developing an uptrend. The intraday targets are found at classic Pivot levels of 1.1946 – 1.0996 – 1.1074. The bulls' inability to maintain control of the situation may bring the pair back to the key levels located at 1.0868-63 (central Pivot level of the day + weekly long-term trend). Consolidation below this range will bring the focus back on the bearish targets at 1.0818 – 1.0740 – 1.0690 (supports of classic Pivot levels).
GBP/USD
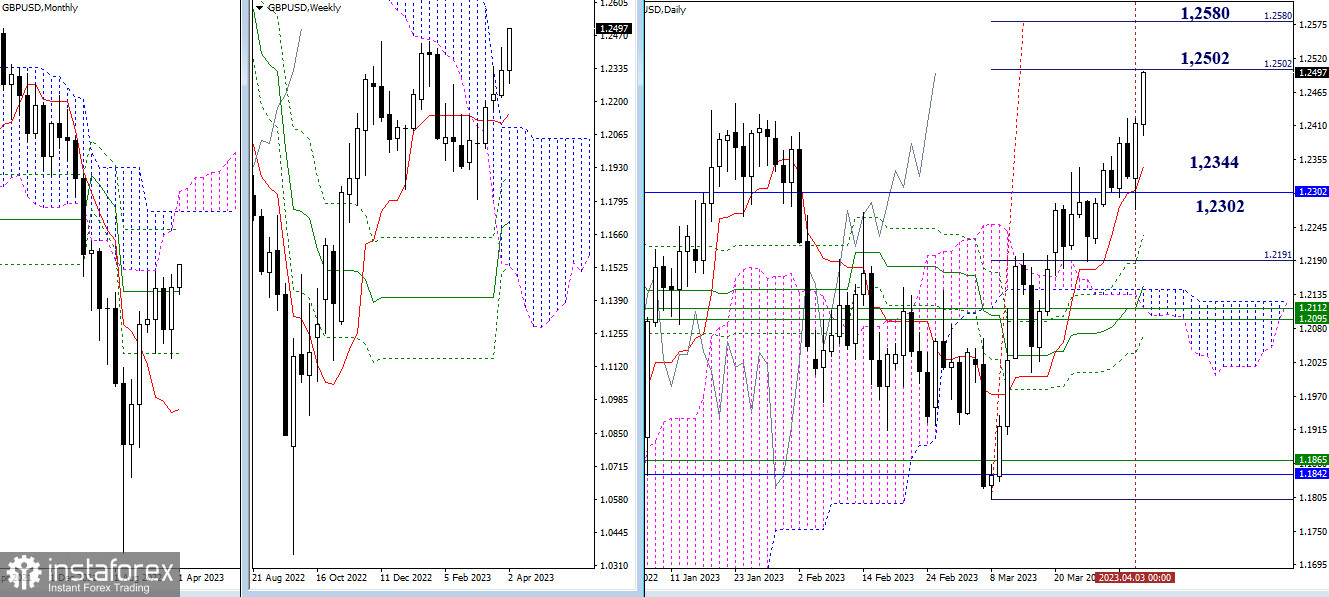
Higher time frames
Yesterday, the bulls managed to stay above the monthly medium-term trend (1.2302). Moreover, using the monthly support and the support of the daily short-term trend (1.2306), they bounced upwards, thus intensifying the bullish bias. The high of the monthly consolidation at 1.2447 has already been updated, and the 100% target for the breakout of the daily Ichimoku cloud (1.2502 – 1.2580) may act as the next target. Above, we can see the resistance of the monthly level at 1.2761.
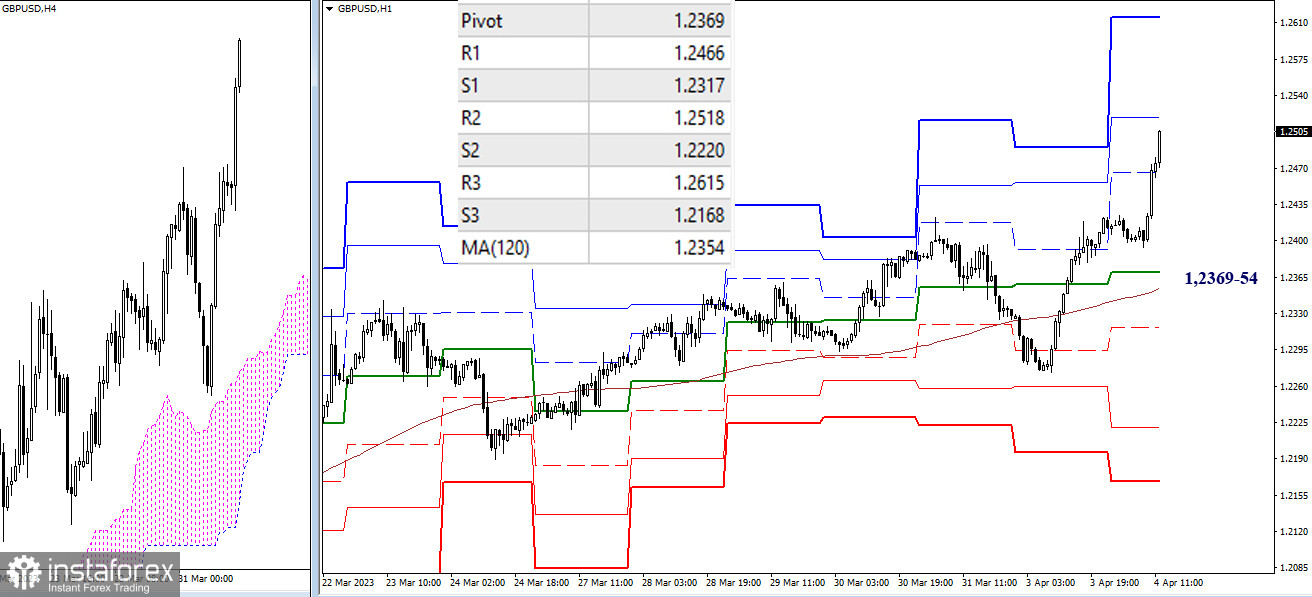
H4 – H1
On lower time frames, the buyers have taken control of the market and are actively moving the price higher. Their intraday targets are located at the resistances of the classic Pivot levels of 1.2518 (R2) and 1.2615 (R3). The key levels of lower time frames today serve as support and are located in the area of 1.2369 (central Pivot level) and 1.2354 (weekly long-term trend).
***
Technical analysis is based on:
Higher time frames – Ichimoku Kinko Hyo (9.26.52) + Fibo Kijun levels
Lower time frames – H1: Pivot Points (standard) + 120-day Moving Average (weekly long-term trend)
*تعینات کیا مراد ہے مارکیٹ کے تجزیات یہاں ارسال کیے جاتے ہیں جس کا مقصد آپ کی بیداری بڑھانا ہے، لیکن تجارت کرنے کے لئے ہدایات دینا نہیں.
InstaSpot analytical reviews will make you fully aware of market trends! Being an InstaSpot client, you are provided with a large number of free services for efficient trading.


