


انسٹا فاریکس ٹیم میں لیجنڈ!
لیجنڈ!آپ کو لگتا ہے کہ یہ حیرت انگیز بیانات ہے؟ لیکن ہمیں ایسے شخص کو کیا کہنا چاہئے ، جو 18 سال میں جونیئر ورلڈ شطرنج چیمپئن شپ جیتنے والا پہلا ایشین بن گیا تھا اور 19 میں پہلا ہندوستانی گرینڈ ماسٹر بنا؟ ورلڈ چیمپیئن ٹائٹل کے لئے یہ مشکل آغاز تھا جو وشونااتھ آنند کے لئے تھا ، وہ شخص جو ہمیشہ کے لئے شطرنج کی تاریخ کا حصہ بن گیا تھا۔ انسٹا فاریکس ٹیم میں اب ایک اور لیجنڈ!


Borussia is one of the most titled football clubs in Germany, which has repeatedly proved to fans: the spirit of competition and leadership will certainly lead to success. Trade in the same way that sports professionals play the game: confidently and actively. Keep a "pass" from Borussia FC and be in the lead with InstaSpot!

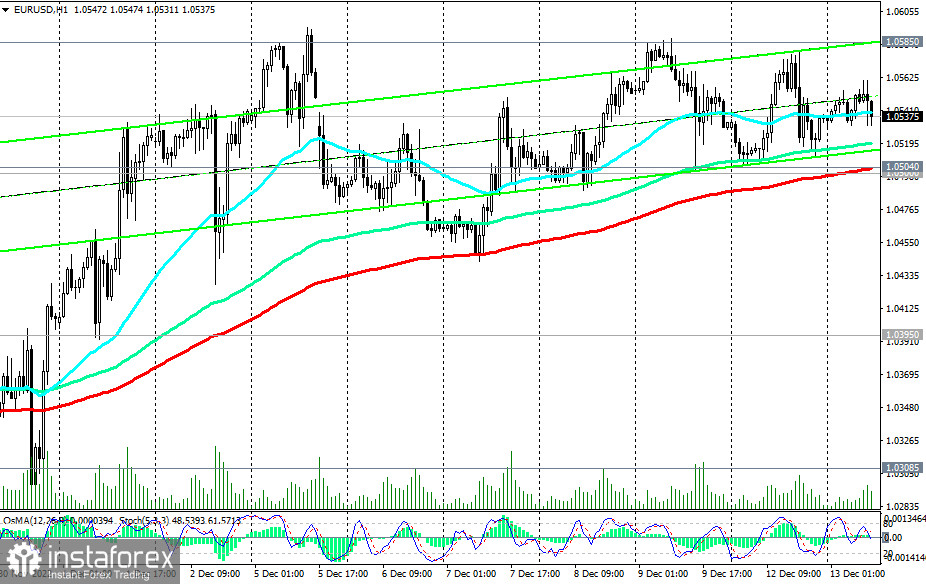
For the fourth trading day in a row, EUR/USD continues to trade in the range between the levels of 1.0500 (50 EMA on the weekly chart) and 1.0585 (local resistance level). During today's Asian trading session, EUR/USD attempted to resume growth, but it was not very successful, and with the beginning of the European session, the pair began to decline again, returning to the mark and the opening price of this trading week at 1.0530.
The central events of this week for EUR/USD are the meetings of the Fed and the ECB. A lot will depend on their results in the further dynamics of the pair.
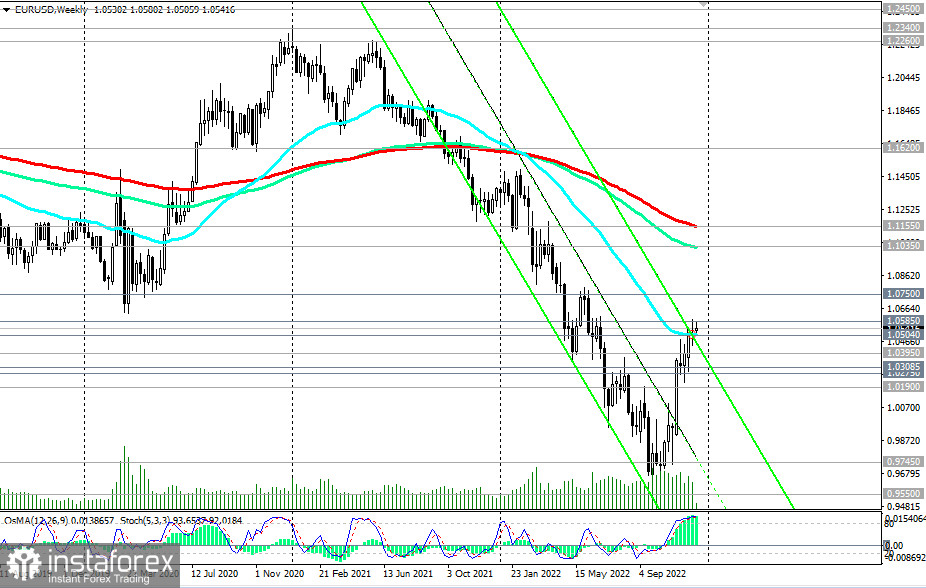
From a technical point of view, a breakdown of the upper limit of the range of 1.0585 will be a signal for the resumption of long positions, a breakdown of the 1.0450 local support level will be for short positions. In the first case, the immediate target for further growth of the pair will be the resistance levels 1.0700, 1.0750. A break into the zone above the key resistance levels 1.1035 (144 EMA on the weekly chart), 1.1155 (200 EMA on the weekly chart) will mean the final breakdown of the EUR/USD bearish trend.
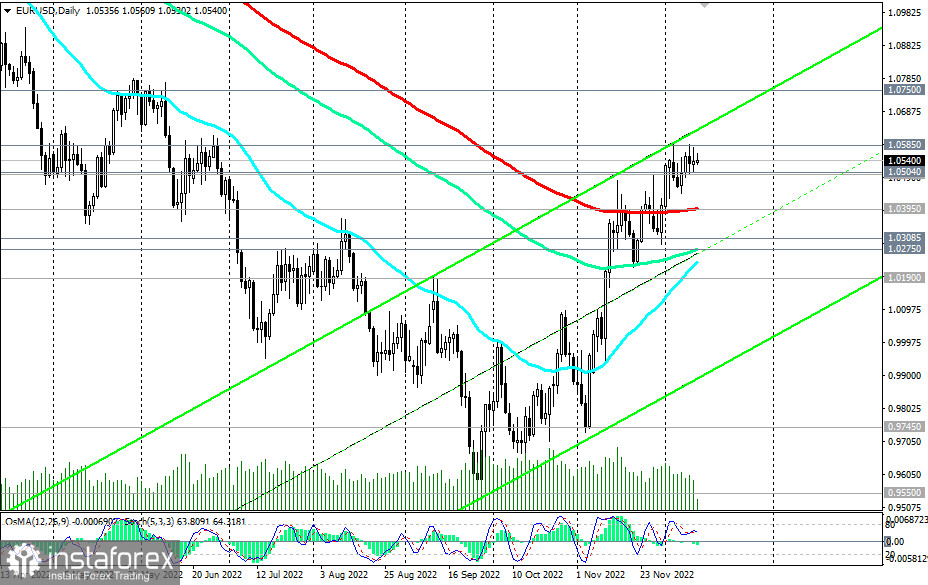
In the second case, the breakdown of the important long-term support at 1.0395 (200 EMA on the daily chart) will trigger further decline, and the breakdown of the 1.0275 support (144 EMA on the daily chart) will trigger a return to a global bearish trend.
As we noted in one of our previous reviews, in general, the EUR/USD global downward trend remains, and from a fundamental point of view, we should expect a resumption of decline, at the least, and at a maximum, a further fall of the pair towards 20-year lows, when it traded near 0.8700, 0.8600. But we are following the results of the Fed and the ECB meetings.
Support levels: 1.0504, 1.0500, 1.0450, 1.0395, 1.0308, 1.0275, 1.0190, 1.0000, 0.9745, 0.9700, 0.9600, 0.9550, 0.9500
Resistance levels: 1.0585, 1.0600, 1.0700, 1.0750, 1.1035, 1.1100, 1.1150
Trading Tips
Sell Stop 1.0440. Stop-Loss 1.0610. Take-Profit 1.0405, 1.0310, 1.0275, 1.0190, 1.0000, 0.9745, 0.9700, 0.9600, 0.9550, 0.9500
Buy Stop 1.0610. Stop-Loss 1.0440. Take-Profit 1.0700, 1.0750, 1.1035, 1.1100, 1.1150
*تعینات کیا مراد ہے مارکیٹ کے تجزیات یہاں ارسال کیے جاتے ہیں جس کا مقصد آپ کی بیداری بڑھانا ہے، لیکن تجارت کرنے کے لئے ہدایات دینا نہیں.
InstaSpot analytical reviews will make you fully aware of market trends! Being an InstaSpot client, you are provided with a large number of free services for efficient trading.


