


ہمارے ٹیم میں 7000000 سے ذائد تاجران شامل ہیں
ہم تجارت کی بہتری کے لئے ہر روز اکھٹے کام کرتے ہیں اور بہترین نتائج حاصل کرتے ہوئے آگے کی جانب بڑھتے ہیں
دُنیا بھر سے سے لاکھوں ہمارے بہترین کام کو سند عطاء کرتے ہیں آپ اپنا انتحاب کریں باقی ہم آپ کی توقعات پر پورا اترنے کے لئے اپنی بہترین کوشش کریں گے
ہم مل کر ایک بہترین ٹیم بناتے ہیں
انسٹا فاریکس آپ سے کام کرتے ہوئے فخر محسوس کرتا ہے


ایکٹر - یو سی ایف 6 ٹورنامنٹ چیمپین اور واقعی ہیرو
ایک فرد کے جس نے اپنا آپ منوایا ہے وہ فرد کہ جو ہماری راہ پر چلا ہے.
ٹکٹا روو کی کامیابی کا راز یہ ہے کہ وہ اپنے اہداف کی جانب مسلسل بڑھتا رہتا ہے
اپنے ہنر یا ٹیلنٹ کے تمام پہلو آشکار کررہے ہیں
پہچانیں ، کوشش کریں ، ناکام ہوں لیکن کبھی نہ رُکیں
انسٹا فاریکس آپ کی کامیابی کی کہاں یہاں سے شروع ہوتی ہے

EUR/USD
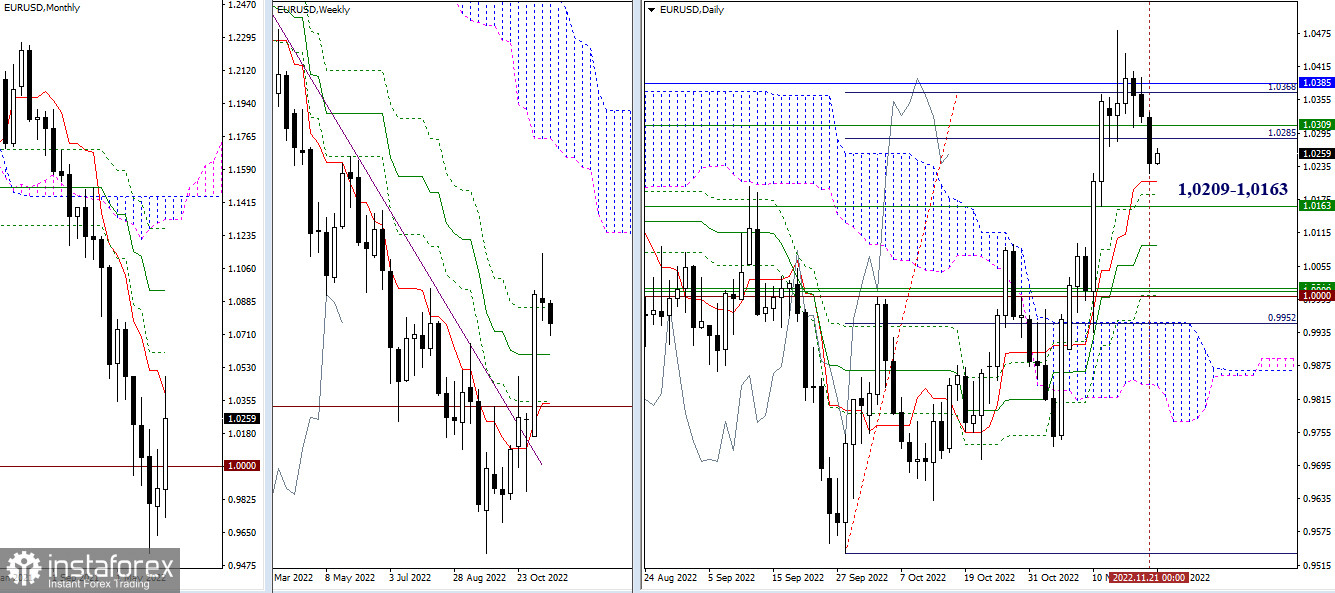
Longer time frames
Yesterday, bears were taking the lead. They managed to drag the price down but failed to reach the support level of the daily short-term trend (1.0209). The area combining the daily levels (1.0209 - 1.0185) and the weekly medium-term trend (1.0163) now serves as the biggest obstacle in the way of bears. The current resistance and attraction area are still being protected by the zone of 1.0285 - 1.0309 - 1.0369 - 1.0385 (final levels of the weekly Ichimoku cross + monthly short-term trend + a breakout of the daily cloud).
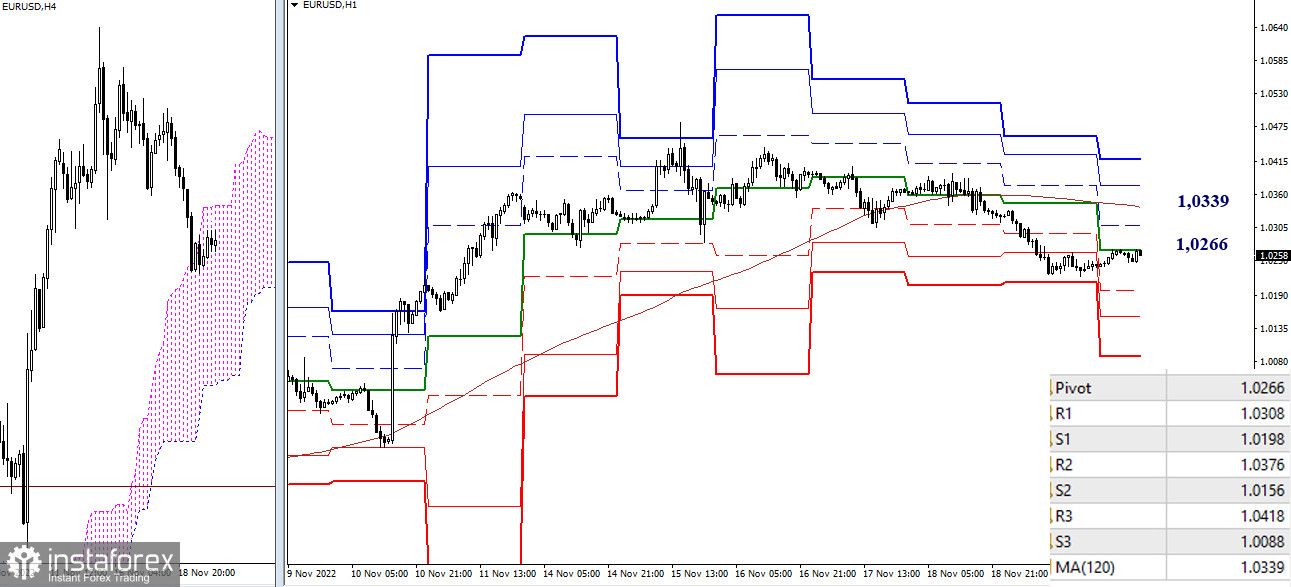
H4 – H1
In shorter time frames, the pace of a corrective move seems to have slowed down. The pair is testing the resistance of the central pivot point (1.0266). The resistance of the weekly long-term trend (1.0339) may be of great importance to bull players today. If the price consolidates above this level, market sentiment will shift. If the pair continues to decline, one can regard 1.0198 – 1.0156 – 1.0088 (classic pivot points) as intraday target levels for today.
***
GBP/USD
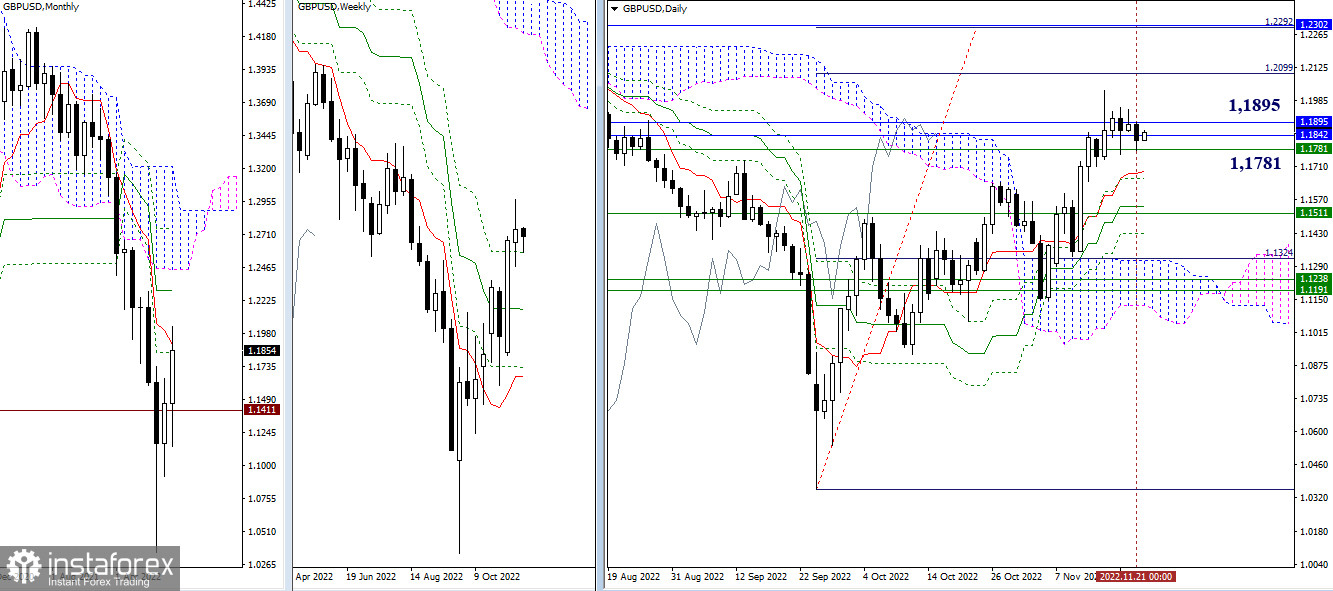
Longer time frames
The situation has barely changed over the past day. The pair is still moving in the area of 1.1781 - 1.1842 - 1.1895 (weekly and monthly levels). Trading activity will increase only after the price gets out of this range. If bulls regain control of this area, the pair will most likely head for the levels of 1.2099 - 1.2292 - 1.2302 (daily target amid a breakout of the cloud + monthly medium-term trend). Alternatively, bears may take the lead if the price overcomes the support levels of the daily Ichimoku cross (1.1690 - 1.1658 - 1.1544), which are pretty strong given the weekly medium-term trend.
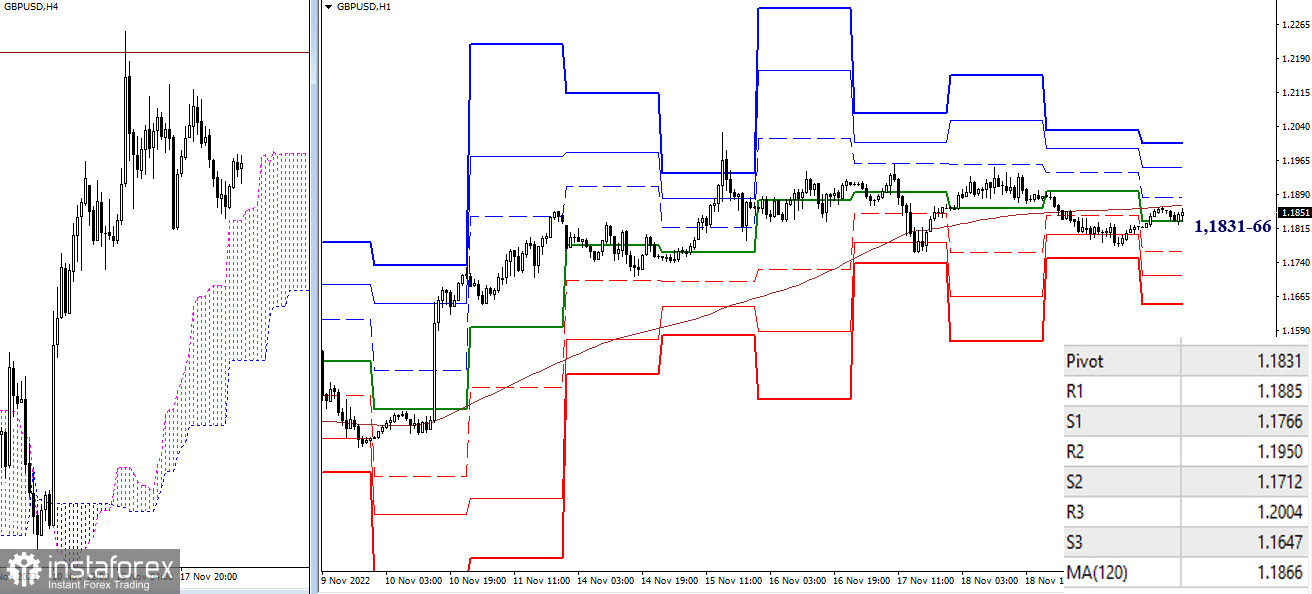
H4 – H1
Notably, shorter time frames indicate that the pair is trading around the key levels of 1.1831-66 (central pivot point + weekly long-term trend). This means that the situation is uncertain. In case of a shift in intraday market sentiment, one can focus on the classic pivot points - support levels at 1.1766 - 1.1712 - 1.1647 and resistance levels at 1.1885 - 1.1950 - 1.2004.
***
Technical analysis uses:
longer time frames – Ichimoku Kinko Hyo (9.26.52) + Fibo Kijun levels
H1 - Pivot Points (classic) + 120-day Moving Average (weekly long-term trend)
*تعینات کیا مراد ہے مارکیٹ کے تجزیات یہاں ارسال کیے جاتے ہیں جس کا مقصد آپ کی بیداری بڑھانا ہے، لیکن تجارت کرنے کے لئے ہدایات دینا نہیں.
InstaSpot analytical reviews will make you fully aware of market trends! Being an InstaSpot client, you are provided with a large number of free services for efficient trading.


