


ہمارے ٹیم میں 7000000 سے ذائد تاجران شامل ہیں
ہم تجارت کی بہتری کے لئے ہر روز اکھٹے کام کرتے ہیں اور بہترین نتائج حاصل کرتے ہوئے آگے کی جانب بڑھتے ہیں
دُنیا بھر سے سے لاکھوں ہمارے بہترین کام کو سند عطاء کرتے ہیں آپ اپنا انتحاب کریں باقی ہم آپ کی توقعات پر پورا اترنے کے لئے اپنی بہترین کوشش کریں گے
ہم مل کر ایک بہترین ٹیم بناتے ہیں
انسٹا فاریکس آپ سے کام کرتے ہوئے فخر محسوس کرتا ہے


ایکٹر - یو سی ایف 6 ٹورنامنٹ چیمپین اور واقعی ہیرو
ایک فرد کے جس نے اپنا آپ منوایا ہے وہ فرد کہ جو ہماری راہ پر چلا ہے.
ٹکٹا روو کی کامیابی کا راز یہ ہے کہ وہ اپنے اہداف کی جانب مسلسل بڑھتا رہتا ہے
اپنے ہنر یا ٹیلنٹ کے تمام پہلو آشکار کررہے ہیں
پہچانیں ، کوشش کریں ، ناکام ہوں لیکن کبھی نہ رُکیں
انسٹا فاریکس آپ کی کامیابی کی کہاں یہاں سے شروع ہوتی ہے

EUR/USD
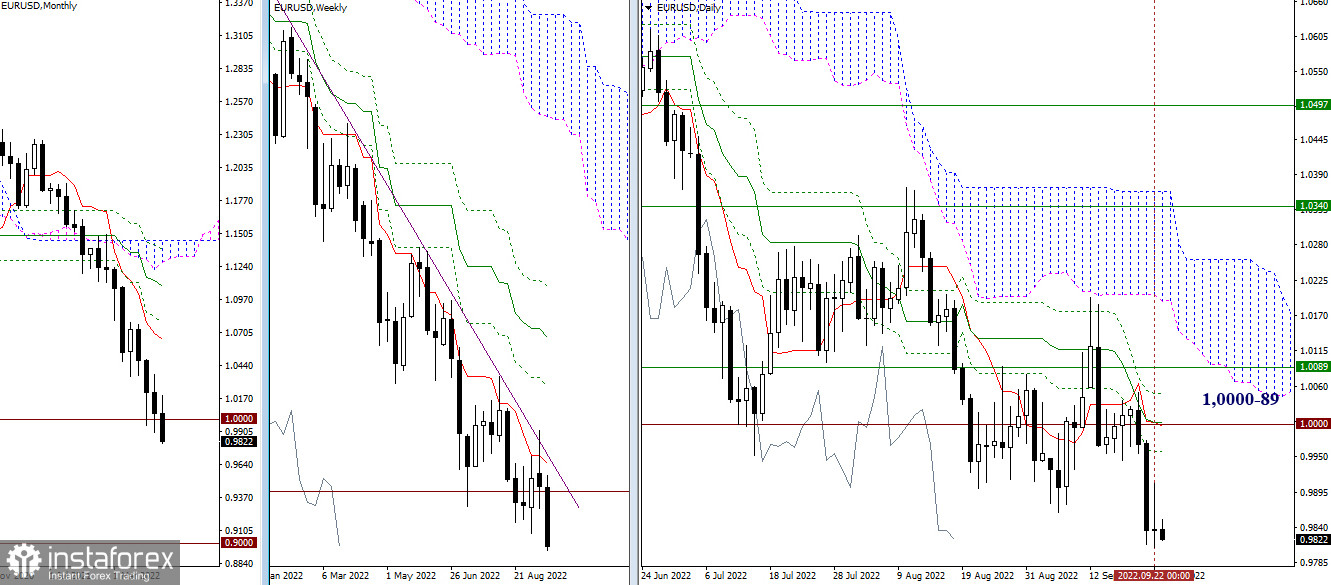
Higher timeframes
After a good result in the implementation of the movement, a slowdown was again observed yesterday. The pair suspended its decline. If the pause ends with the resumption of bearish activity, the next significant target will be 0.9000 (psychological level), and then attention will be directed to 0.8225 (2000 low). The levels passed earlier are now combining their efforts to form a resistance zone at 1.0000 – 1.0089 (psychological level + daily cross + weekly short-term trend).
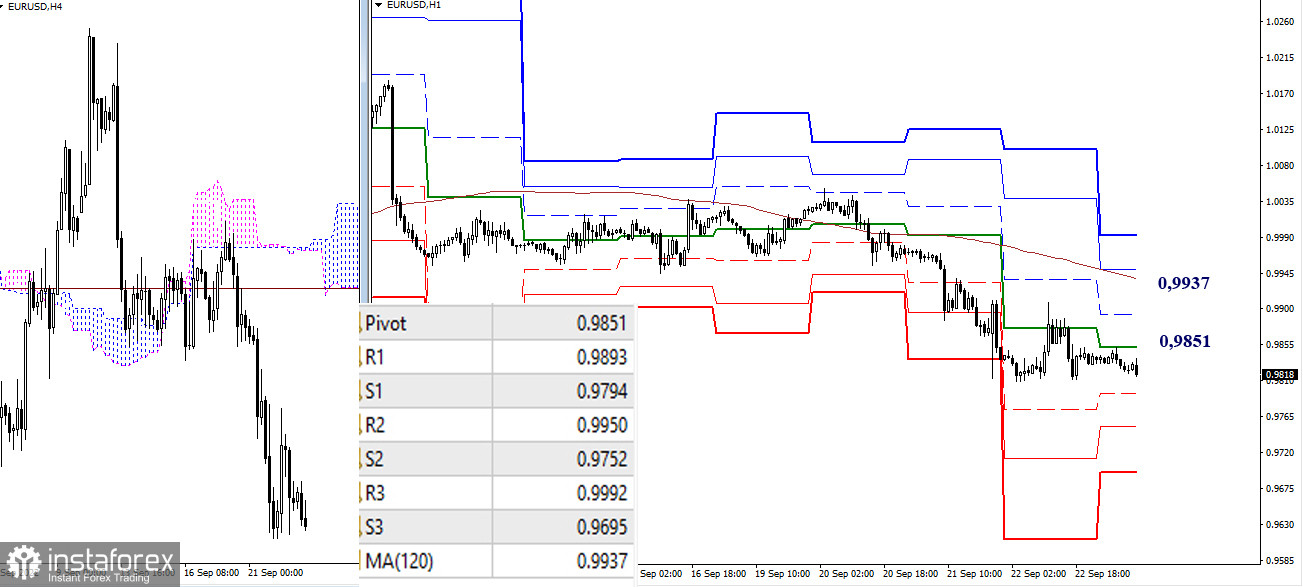
H4 – H1
The pair, as of writing, is trading in the correction zone on the lower timeframes; its development has slowed down. The exit from the correction zone and the continuation of the decline will return the relevance of the downward benchmarks within the day at 0.9794 - 0.9752 - 0.9695 (support for the classic pivot points). If the bulls seize the initiative and manage to return to the development of a corrective rise, then the main reference points of the lower timeframes in the current situation are now at 0.9851 (central pivot point of the day) and 0.9937 (weekly long-term trend). Consolidation above and reversal of the moving average can change the current balance of power in favor of the bulls and further strengthening of bullish sentiment.
***
GBP/USD
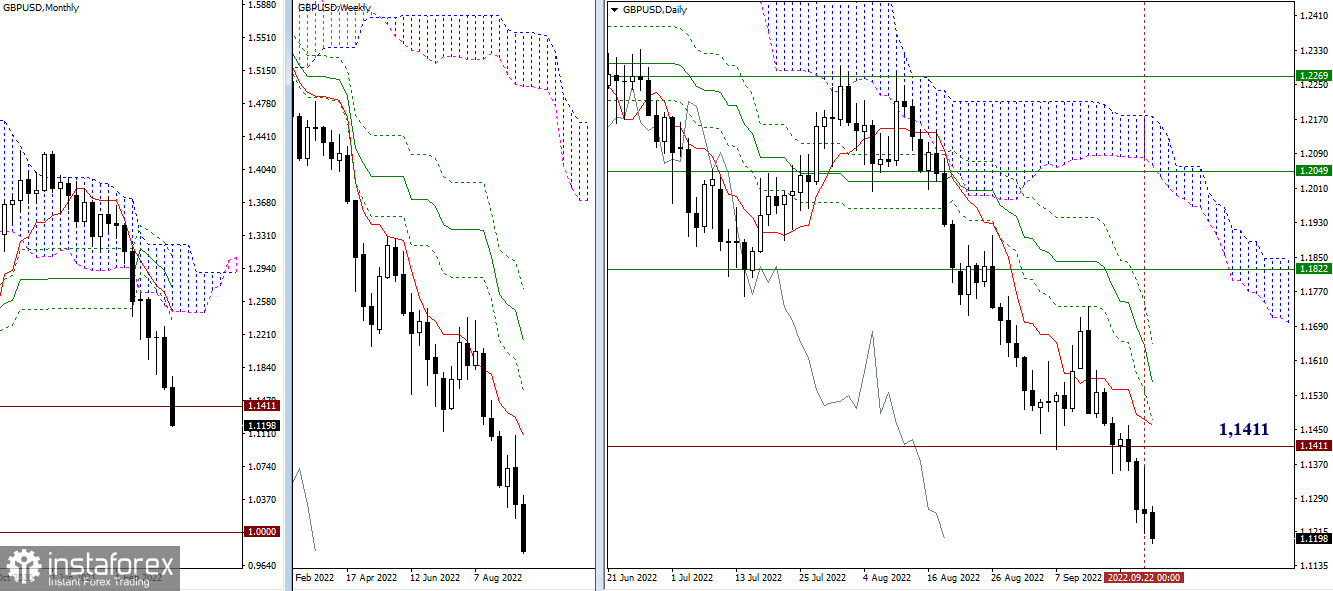
Higher timeframes
After a short pause yesterday, the low have been updated again, and the decline resumed. The levels left behind are now forming resistance, so the nearest resistance in the higher timeframes can now be noted at the level of 1.1411 (2020 low). If the downward trend continues to develop, the psychological level 1.0000 may become a significant downward target.
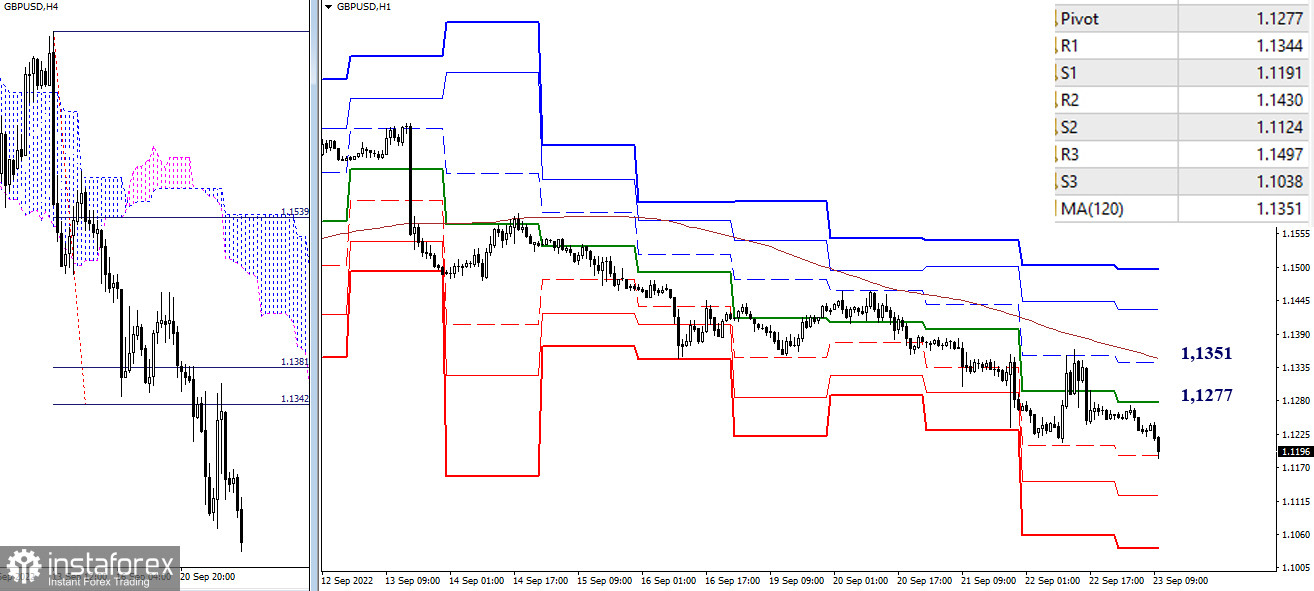
H4 – H1
After the retest of the broken target, the bears resumed the decline. Today, downward targets within the day are 1.1191 - 1.1124 - 1.1038 (support of the classic pivot points). The key levels of lower timeframes form resistances at 1.1277 (central pivot point) and 1.1351 (weekly long-term trend). If key resistances are overcome, the current balance of power may change.
***
In the technical analysis of the situation, the following are used:
higher timeframes – Ichimoku Kinko Hyo (9.26.52) + Fibo Kijun levels
H1 - Pivot Points (classic) + Moving Average 120 (weekly long-term trend)
*تعینات کیا مراد ہے مارکیٹ کے تجزیات یہاں ارسال کیے جاتے ہیں جس کا مقصد آپ کی بیداری بڑھانا ہے، لیکن تجارت کرنے کے لئے ہدایات دینا نہیں.
InstaSpot analytical reviews will make you fully aware of market trends! Being an InstaSpot client, you are provided with a large number of free services for efficient trading.


