


ہمارے ٹیم میں 7000000 سے ذائد تاجران شامل ہیں
ہم تجارت کی بہتری کے لئے ہر روز اکھٹے کام کرتے ہیں اور بہترین نتائج حاصل کرتے ہوئے آگے کی جانب بڑھتے ہیں
دُنیا بھر سے سے لاکھوں ہمارے بہترین کام کو سند عطاء کرتے ہیں آپ اپنا انتحاب کریں باقی ہم آپ کی توقعات پر پورا اترنے کے لئے اپنی بہترین کوشش کریں گے
ہم مل کر ایک بہترین ٹیم بناتے ہیں
انسٹا فاریکس آپ سے کام کرتے ہوئے فخر محسوس کرتا ہے


ایکٹر - یو سی ایف 6 ٹورنامنٹ چیمپین اور واقعی ہیرو
ایک فرد کے جس نے اپنا آپ منوایا ہے وہ فرد کہ جو ہماری راہ پر چلا ہے.
ٹکٹا روو کی کامیابی کا راز یہ ہے کہ وہ اپنے اہداف کی جانب مسلسل بڑھتا رہتا ہے
اپنے ہنر یا ٹیلنٹ کے تمام پہلو آشکار کررہے ہیں
پہچانیں ، کوشش کریں ، ناکام ہوں لیکن کبھی نہ رُکیں
انسٹا فاریکس آپ کی کامیابی کی کہاں یہاں سے شروع ہوتی ہے

The USD/CAD pair is trading in the red corridor at 1.3489 on the H1 at the time of writing. It signaled that the upside movement is over and that the sellers could take the lead. It declined sharply as the US dollar index lost ground.
Later, the US economic figures could be decisive. Worse-than-expected data could send the USD/CAD toward fresh new lows. The Richmond Manufacturing Index and the Pending Home Sales will be published. Only better-than-expected data could help USD to rebound.
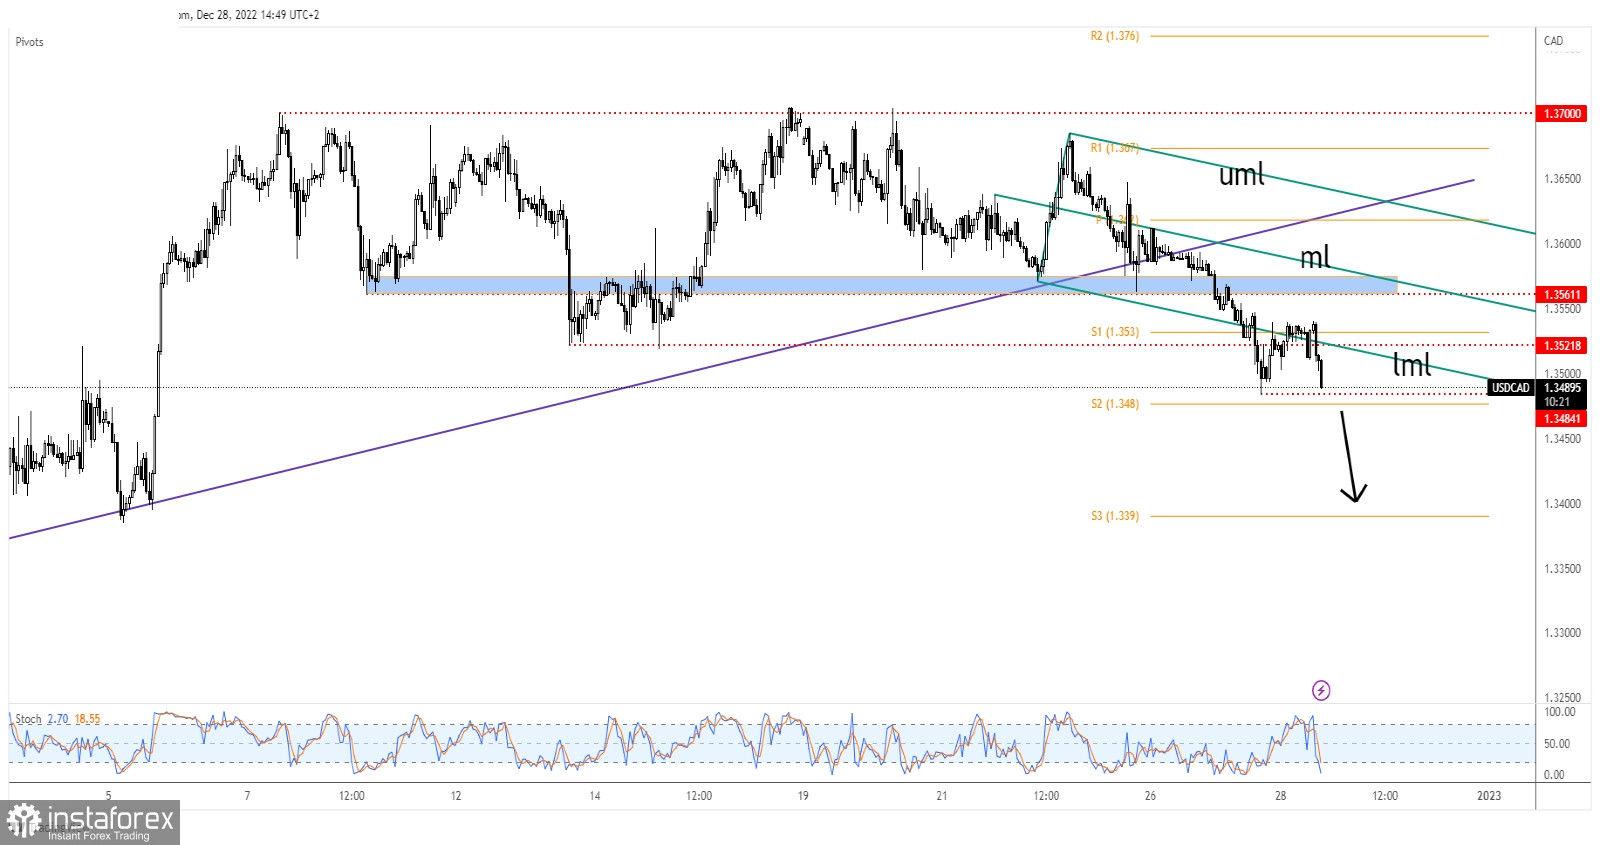
Technically, the USD/CAD was somehow expected to develop a larger drop after breaking below the uptrend line. It dipped below the 1.3561 and 1.3521 support levels signaling downside pressure.
It tried to rebound but it failed to stay above 1.3521 and above the lower median line (lml). It may hit 1.3484.
A valid breakout below 1.3484 and through the S2 (1.3480) brings new selling opportunities. The weekly S3 (1.3390) represents a downside target.
*تعینات کیا مراد ہے مارکیٹ کے تجزیات یہاں ارسال کیے جاتے ہیں جس کا مقصد آپ کی بیداری بڑھانا ہے، لیکن تجارت کرنے کے لئے ہدایات دینا نہیں.
InstaSpot analytical reviews will make you fully aware of market trends! Being an InstaSpot client, you are provided with a large number of free services for efficient trading.


