


ہمارے ٹیم میں 7000000 سے ذائد تاجران شامل ہیں
ہم تجارت کی بہتری کے لئے ہر روز اکھٹے کام کرتے ہیں اور بہترین نتائج حاصل کرتے ہوئے آگے کی جانب بڑھتے ہیں
دُنیا بھر سے سے لاکھوں ہمارے بہترین کام کو سند عطاء کرتے ہیں آپ اپنا انتحاب کریں باقی ہم آپ کی توقعات پر پورا اترنے کے لئے اپنی بہترین کوشش کریں گے
ہم مل کر ایک بہترین ٹیم بناتے ہیں
انسٹا فاریکس آپ سے کام کرتے ہوئے فخر محسوس کرتا ہے


ایکٹر - یو سی ایف 6 ٹورنامنٹ چیمپین اور واقعی ہیرو
ایک فرد کے جس نے اپنا آپ منوایا ہے وہ فرد کہ جو ہماری راہ پر چلا ہے.
ٹکٹا روو کی کامیابی کا راز یہ ہے کہ وہ اپنے اہداف کی جانب مسلسل بڑھتا رہتا ہے
اپنے ہنر یا ٹیلنٹ کے تمام پہلو آشکار کررہے ہیں
پہچانیں ، کوشش کریں ، ناکام ہوں لیکن کبھی نہ رُکیں
انسٹا فاریکس آپ کی کامیابی کی کہاں یہاں سے شروع ہوتی ہے

The macroeconomic calendar is empty for the third day in a row, market dynamics are low, and quotes follow technical patterns.
Analysis of trading charts from February 9:
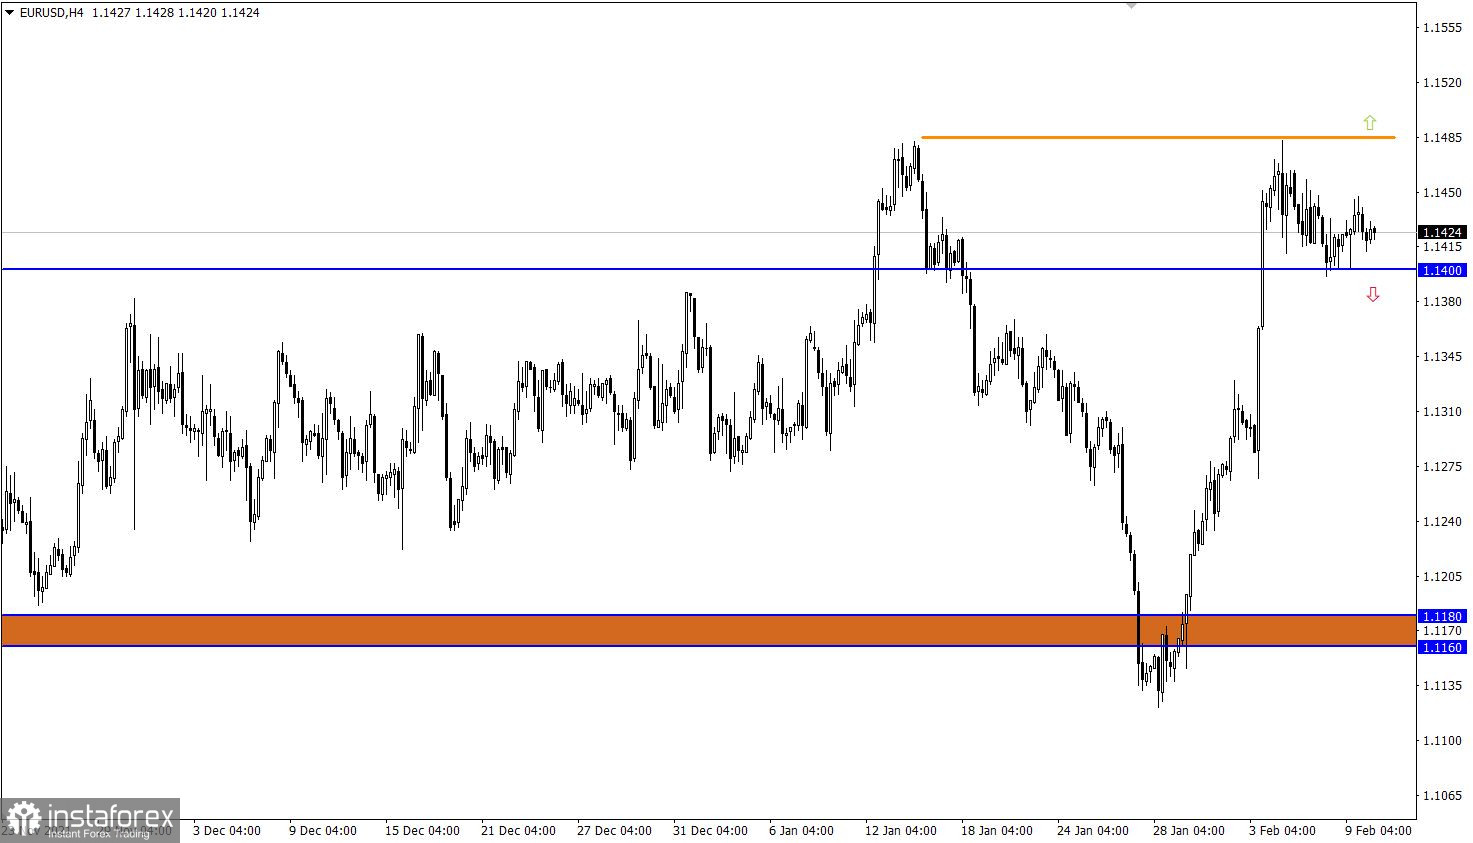
The EUR/USD pair has been moving inside the side channel of 1.1400/1.1480 for the fifth day in a row, showing low activity. The characteristic stagnation leads to confusion in the market, but it is worth considering that we are currently dealing with the process of accumulation of trading forces in the upcoming acceleration.
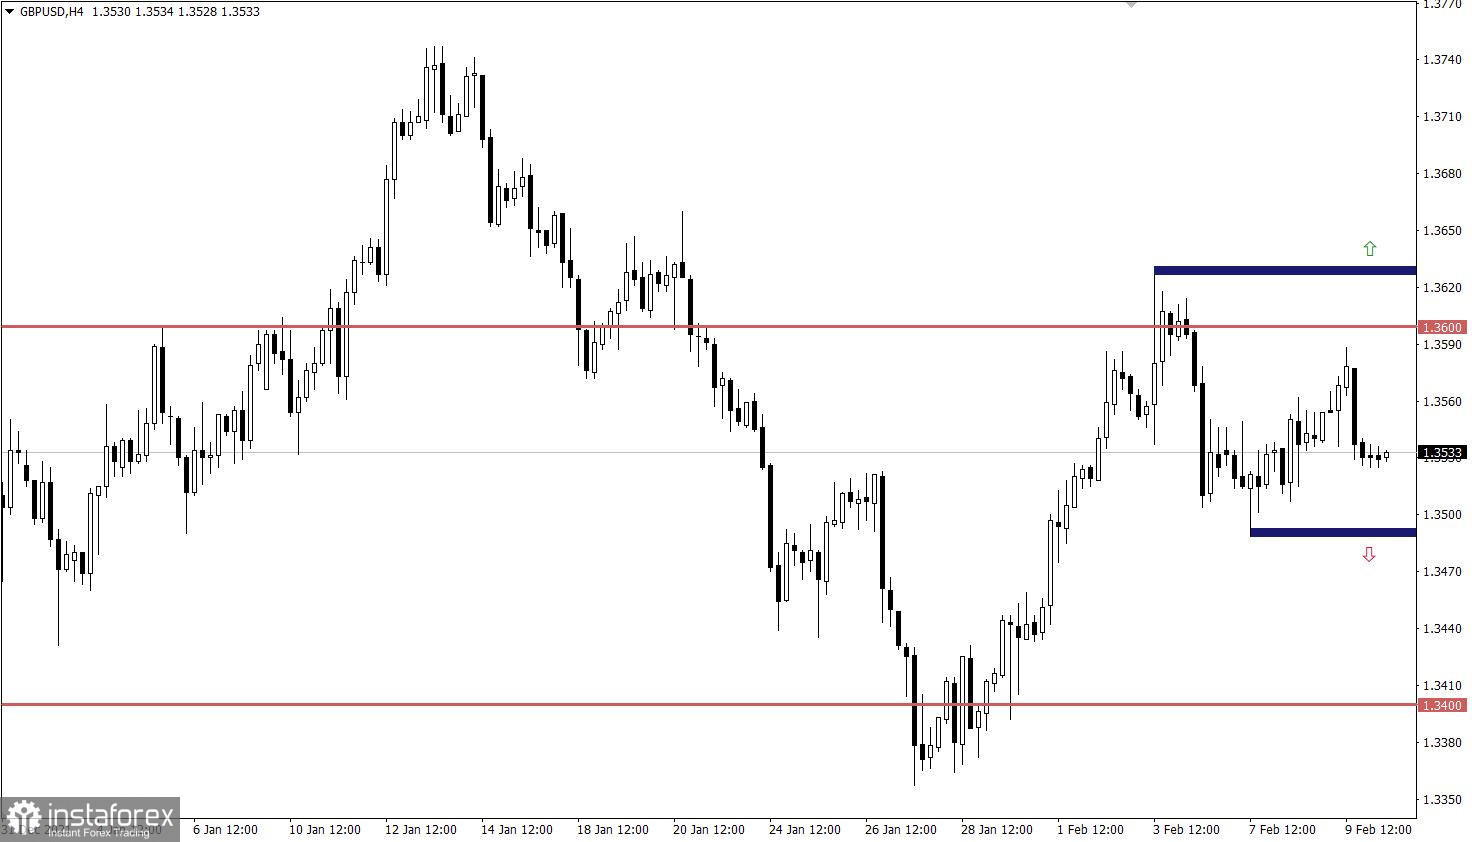
The GBP/USD pair continues to concentrate within its deviation despite the rebound from the resistance level of 1.3600 last week. This signals a characteristic uncertainty among traders, which may play into the hands of speculators.

February 10 economic calendar:
The US inflation data may have a strong impact on the market after an empty macroeconomic calendar for several consecutive days. So, it is expected that consumer prices will continue to grow from 7.0% to 7.3%. This will definitely provoke speculators to action.
Weekly data on applications for US unemployment benefits will also be published, where a slight reduction in their volume is predicted. This is a positive factor for the US labor market.
Statistics details:
Time targeting
US inflation - 13:30 Universal time
Applications for US unemployment benefits - 13:30 Universal time
Trading plan for EUR/USD on Feb 10:
The quote is currently moving in the range of 1.1400/1.1480. It can be assumed that a long-term price movement in a closed amplitude will lead to a regular acceleration if the price is kept outside one or another border.
Therefore, the trading tactic is focused on the breakdown of the flat, which will indicate an impulse movement soon.
We express the above-mentioned into trading signals:
Buy positions should be considered after holding the price above 1.1485 in a four-hour period, with the prospect of moving to 1.1580.
Sell positions should be considered after holding the price below 1.1400 in a four-hour period, with the prospect of moving to 1.1350 - 1.1300.
Trading plan for GBP/USD on Feb 10:
In this situation, the price movement between the resistance level of 1.3600 and the variable pivot point of 1.3500 indicates the process of accumulation of trading forces. At the same time, several Doji-type candlesticks in the daily chart can act as a lever, where an impulse move will be obtained as a result.
Therefore, trading within the established range is considered less attractive than trading on its breakdown. The following values serve as signal levels: 1.3630, when considering buy positions, and 1.3480, if the decline from the resistance level is prolonged towards the level of 1.3400.
What is reflected in the trading charts?
A candlestick chart view is graphical rectangles of white and black light, with sticks on top and bottom. When analyzing each candle in detail, you will see its characteristics of a relative period: the opening price, closing price, and maximum and minimum prices.
Horizontal levels are price coordinates, relative to which a stop or a price reversal may occur. These levels are called support and resistance in the market.
Circles and rectangles are highlighted examples where the price of the story unfolded. This color selection indicates horizontal lines that may put pressure on the quote in the future.
The up/down arrows are the reference points of the possible price direction in the future.
*تعینات کیا مراد ہے مارکیٹ کے تجزیات یہاں ارسال کیے جاتے ہیں جس کا مقصد آپ کی بیداری بڑھانا ہے، لیکن تجارت کرنے کے لئے ہدایات دینا نہیں.
InstaSpot analytical reviews will make you fully aware of market trends! Being an InstaSpot client, you are provided with a large number of free services for efficient trading.


