


ہمارے ٹیم میں 7000000 سے ذائد تاجران شامل ہیں
ہم تجارت کی بہتری کے لئے ہر روز اکھٹے کام کرتے ہیں اور بہترین نتائج حاصل کرتے ہوئے آگے کی جانب بڑھتے ہیں
دُنیا بھر سے سے لاکھوں ہمارے بہترین کام کو سند عطاء کرتے ہیں آپ اپنا انتحاب کریں باقی ہم آپ کی توقعات پر پورا اترنے کے لئے اپنی بہترین کوشش کریں گے
ہم مل کر ایک بہترین ٹیم بناتے ہیں
انسٹا فاریکس آپ سے کام کرتے ہوئے فخر محسوس کرتا ہے


ایکٹر - یو سی ایف 6 ٹورنامنٹ چیمپین اور واقعی ہیرو
ایک فرد کے جس نے اپنا آپ منوایا ہے وہ فرد کہ جو ہماری راہ پر چلا ہے.
ٹکٹا روو کی کامیابی کا راز یہ ہے کہ وہ اپنے اہداف کی جانب مسلسل بڑھتا رہتا ہے
اپنے ہنر یا ٹیلنٹ کے تمام پہلو آشکار کررہے ہیں
پہچانیں ، کوشش کریں ، ناکام ہوں لیکن کبھی نہ رُکیں
انسٹا فاریکس آپ کی کامیابی کی کہاں یہاں سے شروع ہوتی ہے

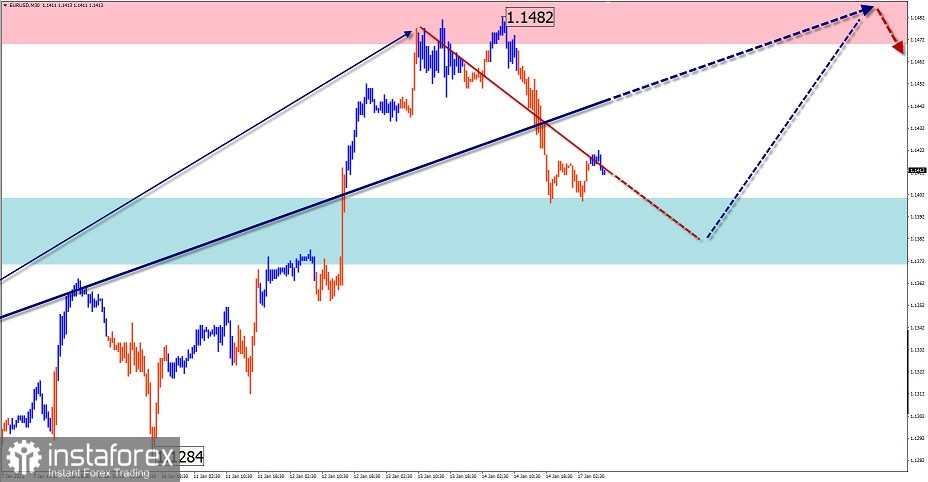
EUR/USD
Analysis:
The direction of intraday price movements of the European currency is set by the bullish wave algorithm from November 24 last year. The structure of the wave has a pronounced flat character. So far, it doesn't look complete. After contact with the lower border of the reversal zone, the price rolled back down.
Outlook:
Today we expect the completion of the decline, a reversal, and a resumption of price growth. The expected range of the daily course is indicated by the calculated zones. When changing the course, a short-term puncture of the lower support boundary cannot be excluded.
Potential reversal zones
Resistance:
- 1.1470/1.1500
Support:
- 1.1400/1.1370
Recommendations:
Prior to the appearance of confirmed buy signals in the support zone, trading transactions in the euro market are not recommended today.
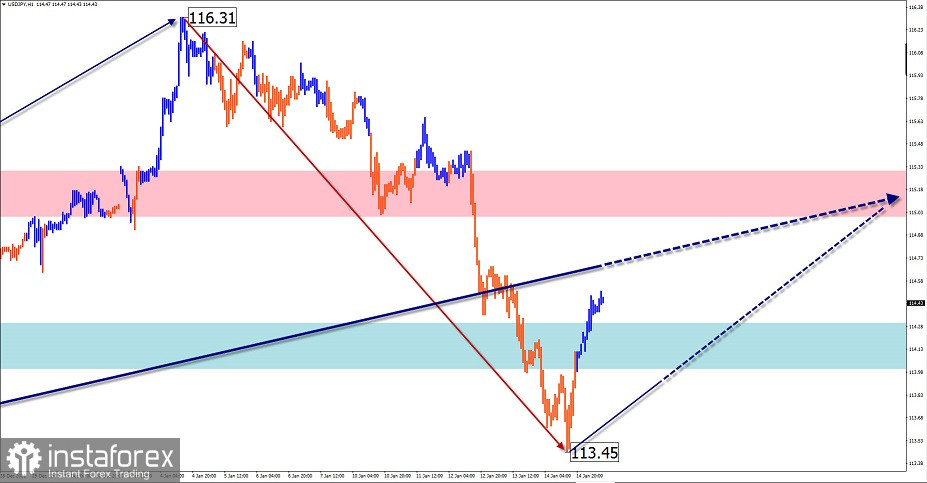
USD/JPY
Analysis:
The market is dominated by a bullish trend. Its unfinished section has been counting down since November 30 last year. In the last two weeks, the price has been rolling down from strong resistance, forming the middle part of the wave (B). The ascending section that started at the end of last week has a reversal potential. When it is confirmed, the final part of the current wave will begin.
Outlook:
In the coming days, a general upward vector of movement from support to the calculated resistance zone is expected. Today, a break of the upper boundary of this zone is possible, but unlikely.
Potential reversal zones
Resistance:
- 115.00/115.30
Support:
- 114.30/114.00
Recommendations:
In the next trading sessions on the USD/JPY pair, intraday purchases are recommended. Profit-taking is optimally done in the area of the calculated resistance.
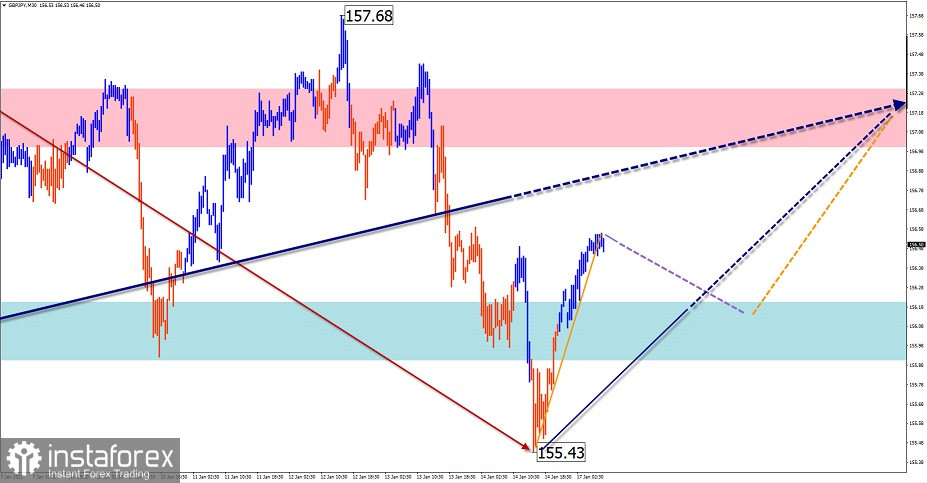
GBP/JPY
Analysis:
As part of the dominant bullish trend at the end of November last year, a corrective shifting plane ended on the chart of the pound/yen cross pair. Over the past month and a half, price quotes have reached the lower limit of strong resistance. In the last decade, the price of the pair rolls back down.
Outlook:
Today, a flat price movement is expected, with a general upward vector. At the next session, a short-term decline to the support area is not ruled out. The active growth phase is more likely at the end of the day or tomorrow.
Potential reversal zones
Resistance:
- 157.00/158.30
Support:
- 156.20/155.90
Recommendations:
There are no conditions for sales on the cross market today. It is recommended to track the buy signals of your trading systems in the area of the calculated support zone.
GOLD
Analysis:
Despite the general flat nature of its movement, an upward wave has been setting the trend direction on the gold chart since last year. Its unfinished section started in November. The structure of this wave has entered the final phase of formation. Since the end of last week, the price has been rolling back in a sideways channel along the support zone of a large TF.
Outlook:
In the next 24 hours, we can expect the completion of the sideways movement, the formation of a reversal, and the resumption of growth in the instrument's quotes.
Potential reversal zones
Resistance:
- 1835.0/1840.0
Support:
- 1810.0/1805.0
Recommendations:
There are no conditions for selling on the gold market today. It is recommended to refrain from entering the market until confirmed buy signals appear in the area of the support zone.
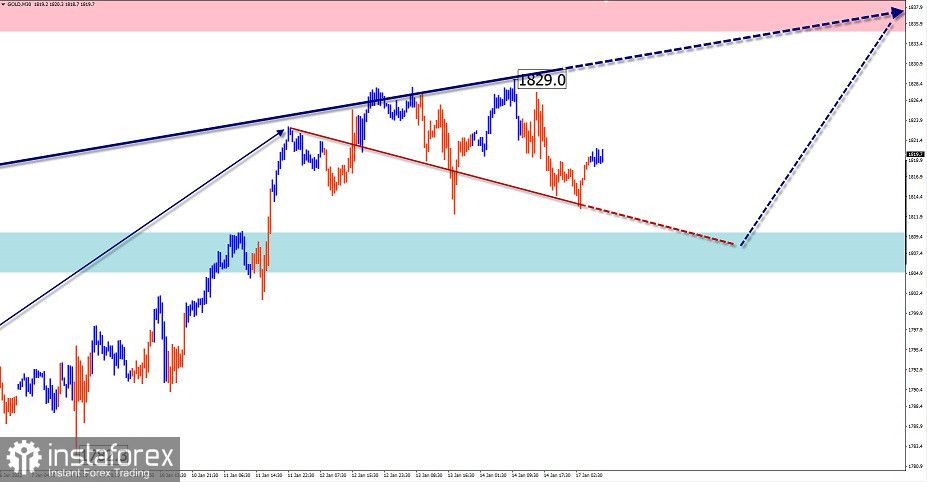
Explanation: In simplified wave analysis (SWA), waves consist of 3 parts (A-B-C). The last unfinished wave is analyzed. The solid arrow background shows the structure formed. The dotted arrow shows the expected movements.
Attention: The wave algorithm does not take into account the duration of the instrument movements over time!
*تعینات کیا مراد ہے مارکیٹ کے تجزیات یہاں ارسال کیے جاتے ہیں جس کا مقصد آپ کی بیداری بڑھانا ہے، لیکن تجارت کرنے کے لئے ہدایات دینا نہیں.
InstaSpot analytical reviews will make you fully aware of market trends! Being an InstaSpot client, you are provided with a large number of free services for efficient trading.


