


انسٹا فاریکس ٹیم میں لیجنڈ!
لیجنڈ!آپ کو لگتا ہے کہ یہ حیرت انگیز بیانات ہے؟ لیکن ہمیں ایسے شخص کو کیا کہنا چاہئے ، جو 18 سال میں جونیئر ورلڈ شطرنج چیمپئن شپ جیتنے والا پہلا ایشین بن گیا تھا اور 19 میں پہلا ہندوستانی گرینڈ ماسٹر بنا؟ ورلڈ چیمپیئن ٹائٹل کے لئے یہ مشکل آغاز تھا جو وشونااتھ آنند کے لئے تھا ، وہ شخص جو ہمیشہ کے لئے شطرنج کی تاریخ کا حصہ بن گیا تھا۔ انسٹا فاریکس ٹیم میں اب ایک اور لیجنڈ!


Borussia is one of the most titled football clubs in Germany, which has repeatedly proved to fans: the spirit of competition and leadership will certainly lead to success. Trade in the same way that sports professionals play the game: confidently and actively. Keep a "pass" from Borussia FC and be in the lead with InstaSpot!

EUR/USD
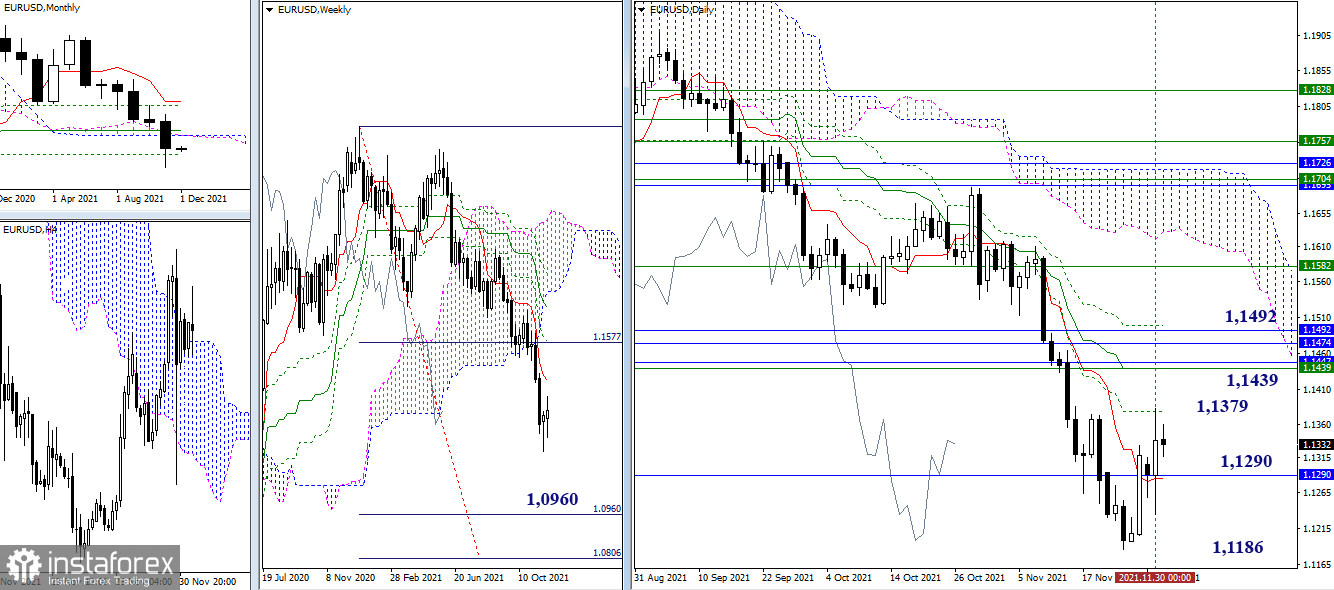
The bears descended to the area of the final border of the monthly Ichimoku gold cross (1.1290) last month. It was not possible to break through the level, the closing of the month was indicated by a long lower shadow of the monthly candle. Therefore, the bulls now have opportunities to develop the rebound from the encountered support. In this situation, it will be possible to make further plans and consider new upward prospects after the formation of a rebound from 1.1290 and consolidation above the important resistance zone of 1.1439 - 1.1492, where several of the strongest levels in the higher timeframes combined (monthly levels + weekly short-term trend + closing levels of the daily Ichimoku cross).
Yesterday, the nearest resistance along the way was tested – the daily Fibo Kijun (1.1379). Alternatively, the breakdown of the monthly support at 1.1290 and the update of the November low (1.1186), will allow us to consider continuing the decline and strengthening the bearish mood. In this case, the closest downward pivot point will be the weekly target for the breakdown of the cloud (1.0806 - 1.0960).
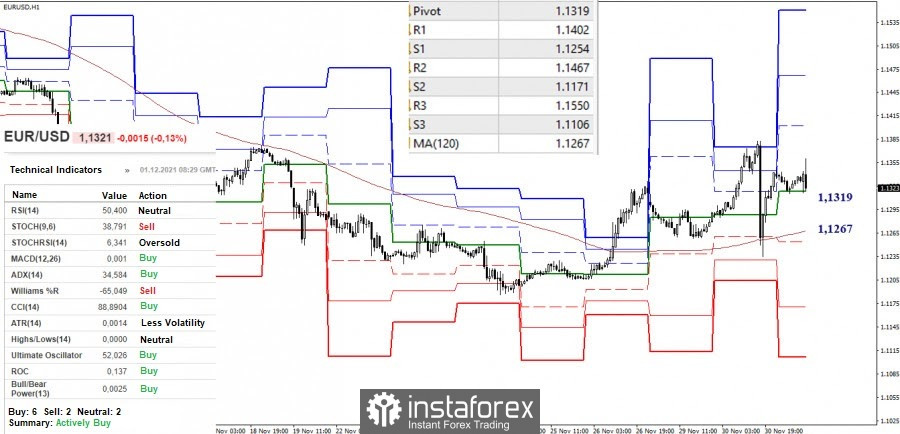
The bulls in the smaller timeframes limited themselves yesterday to testing the final border of the classic pivot levels and failed to continue the rise further. At the moment, they still have the advantage. Today, their intraday pivot points are set at 1.1402 - 1.1467 - 1.1550 (classic pivot levels). The key support levels, which are now located at 1.1319 (central Pivot level) and 1.1267 (weekly long-term trend), allow the bulls to defend their interests despite the long-term trading in the correction zone.
A consolidation below will change the current balance of power and bring back the relevance of bearish targets, such as the minimum extremum (1.1186) and the support of the classic pivot levels (1.1254 - 1.1171 - 1.1106).
GBP/USD
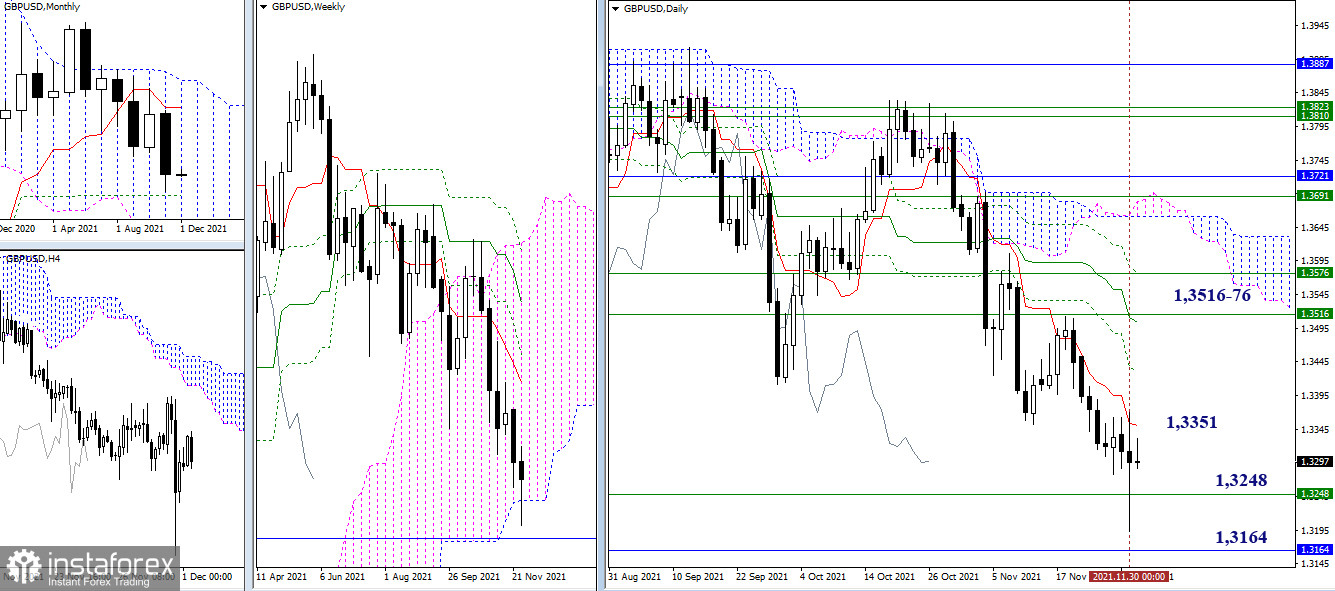
The bears tried to reach the monthly support (1.3164) at the end of the previous month but failed to test the level or close the month next to it. Nevertheless, November indicated the nearest bearish plans – entering the bearish zone relative to the weekly Ichimoku cloud (1.3248) and breaking through the monthly support (1.3164).
As for the bulls, it is important for them to keep their position above the current support and attraction zone 1.3248 (lower border of the weekly cloud) - 1.3164 (monthly Fibo Kijun), regain support for the daily short-term trend (1.3351), and also strive to restore their positions to weekly levels (1.3516-76), eliminate the daily dead cross (1.3503 - 1.3586) and rise to the daily Ichimoku cloud.
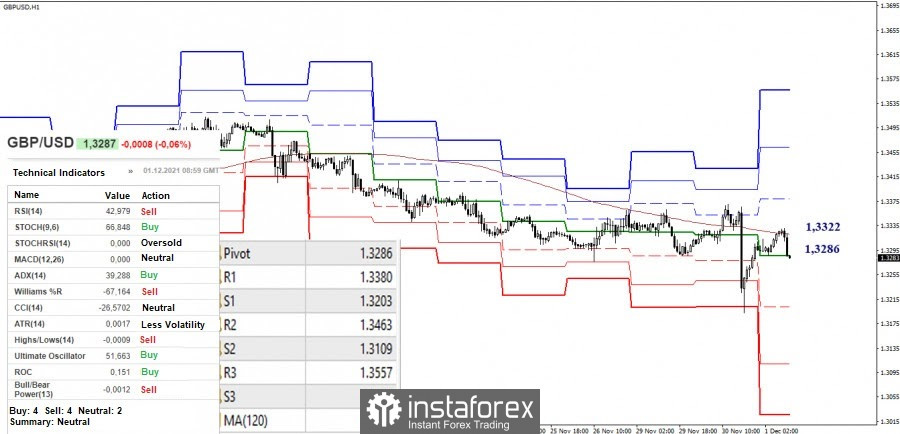
Bullish traders in the smaller intervals failed to consolidate above the key levels and reverse the moving average yesterday, which resulted in the continuing struggle for key levels. Today's key levels are at 1.3286 (central pivot level) and 1.3322 (weekly long-term trend). A movement below the levels gives preference to the bears. Their pivot points are currently set at 1.3203 - 1.3109 - 1.3026 (support for the classic pivot levels). It is worth noting that the aforementioned levels give preference to the bulls. Their upward targets are at 1.3380 - 1.3463 - 1.3557 (resistance levels of the classic pivot levels).
***
Ichimoku Kinko Hyo (9.26.52) and Kijun-sen levels in the higher time frames, as well as classic Pivot Points and Moving Average (120) on the H1 chart, are used in the technical analysis of the trading instruments.
*تعینات کیا مراد ہے مارکیٹ کے تجزیات یہاں ارسال کیے جاتے ہیں جس کا مقصد آپ کی بیداری بڑھانا ہے، لیکن تجارت کرنے کے لئے ہدایات دینا نہیں.
InstaSpot analytical reviews will make you fully aware of market trends! Being an InstaSpot client, you are provided with a large number of free services for efficient trading.


