


ہمارے ٹیم میں 7000000 سے ذائد تاجران شامل ہیں
ہم تجارت کی بہتری کے لئے ہر روز اکھٹے کام کرتے ہیں اور بہترین نتائج حاصل کرتے ہوئے آگے کی جانب بڑھتے ہیں
دُنیا بھر سے سے لاکھوں ہمارے بہترین کام کو سند عطاء کرتے ہیں آپ اپنا انتحاب کریں باقی ہم آپ کی توقعات پر پورا اترنے کے لئے اپنی بہترین کوشش کریں گے
ہم مل کر ایک بہترین ٹیم بناتے ہیں
انسٹا فاریکس آپ سے کام کرتے ہوئے فخر محسوس کرتا ہے


ایکٹر - یو سی ایف 6 ٹورنامنٹ چیمپین اور واقعی ہیرو
ایک فرد کے جس نے اپنا آپ منوایا ہے وہ فرد کہ جو ہماری راہ پر چلا ہے.
ٹکٹا روو کی کامیابی کا راز یہ ہے کہ وہ اپنے اہداف کی جانب مسلسل بڑھتا رہتا ہے
اپنے ہنر یا ٹیلنٹ کے تمام پہلو آشکار کررہے ہیں
پہچانیں ، کوشش کریں ، ناکام ہوں لیکن کبھی نہ رُکیں
انسٹا فاریکس آپ کی کامیابی کی کہاں یہاں سے شروع ہوتی ہے

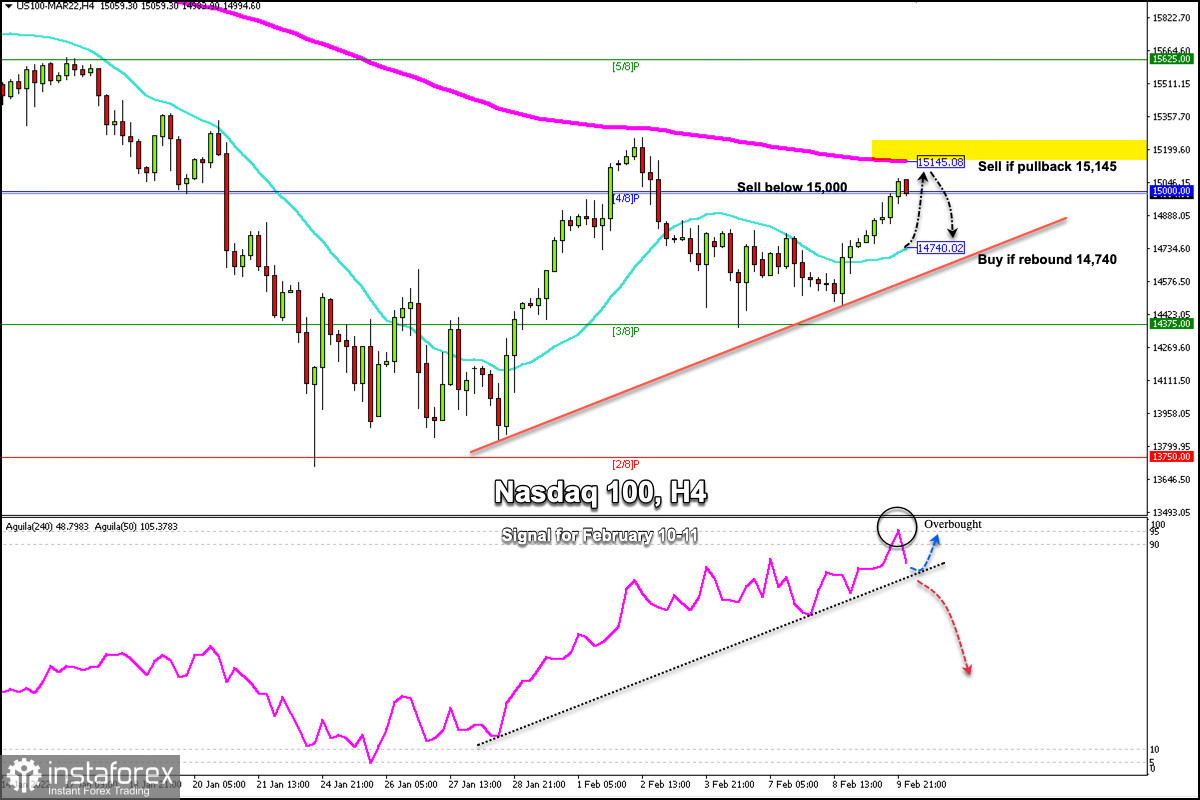
The Nasdaq-100 Tech Index (#NDX) is trading below the 200 EMA and right at the psychological level of 15,000 points.
Nasdaq-100 accumulates a strong upward trend nine days straight. A downward correction is likely in the coming days because it is showing signs of exhaustion.
EMA 200 (15,145) is likely to be a strong resistance for the Nasdaq-100. If the bullish force continues and tests this resistance there could be a technical rejection.
The eagle indicator is showing overbought levels and a technical correction is likely in the next few hours due to the moving average touching the mark of 95-point.
Early in the American session, US inflation data is due to be released and there is likely to be strong volatility across all Wall Street indices.
The main trend is downward according to the daily chart. However, the ongoing upward move has a barrier at the strong resistance of 15,145 (200 EMA). As long as it remains below this level, we can expect the resumption of the dominant trend.
A trade through 15,200 will change the main trend to the upside and we could expect a strong move higher towards the level 15,625 (5/8).
On the other hand, a sharp break below the 21 SMA located at 14,740 and a break of the trend channel could cause an acceleration to the downside towards the support 3/8 Murray at 14,375 (3/8) and up to 13,750 (2/8).
Support and Resistance Levels for February 10 - 11, 2022
Resistance (3) 15,499
Resistance (2) 15,287
Resistance (1) 15,176
----------------------------
Support (1) 14,852
Support (2) 14,640
Support (3) 14,528
***********************************************************
Scenario
Timeframe H4
Recommendation: sell below o if pullback
Entry Point 15,000; 15,145
Take Profit 14,800; 14,740
Stop Loss 15,080; 15,225
Murray Levels 13,750 (2/8), 14,375,(3/8), 15,000 (4/8), 15,625 (5/8)
***************************************************************************
*تعینات کیا مراد ہے مارکیٹ کے تجزیات یہاں ارسال کیے جاتے ہیں جس کا مقصد آپ کی بیداری بڑھانا ہے، لیکن تجارت کرنے کے لئے ہدایات دینا نہیں.
InstaSpot analytical reviews will make you fully aware of market trends! Being an InstaSpot client, you are provided with a large number of free services for efficient trading.


