




Kumpulan kami mempunyai lebih daripada 7,000,000 pedagang!
Setiap hari kami bekerjasama untuk meningkatkan perdagangan. Kami mendapat keputusan yang tinggi dan bergerak ke hadapan.
Pengiktirafan oleh berjuta-juta pedagang di seluruh dunia adalah penghargaan terbaik untuk kerja kami! Anda membuat pilihan anda dan kami akan melakukan segalanya yang diperlukan untuk memenuhi jangkaan anda!
Kami adalah kumpulan yang terbaik bersama!
InstaSpot. Berbangga bekerja untuk anda!





Pelakon, juara kejohanan UFC 6 dan seorang wira sebenar!
Lelaki yang membuat dirinya sendiri. Lelaki yang mengikut cara kami.
Rahsia di sebalik kejayaan Taktarov adalah pergerakan berterusan ke arah matlamat.
Dedahkan semua segi bakat anda!
Cari, cuba, gagal - tetapi tidak pernah berhenti!
InstaSpot. Kisah kejayaan anda bermula di sini!

Gold stabilized after two days of decline, yet it remains under pressure, trading around $4,445 per ounce. Silver remained steady at $66.56, while platinum and palladium showed little change. It's worth noting that over the previous two sessions, the metal lost more than 3.5 percent.
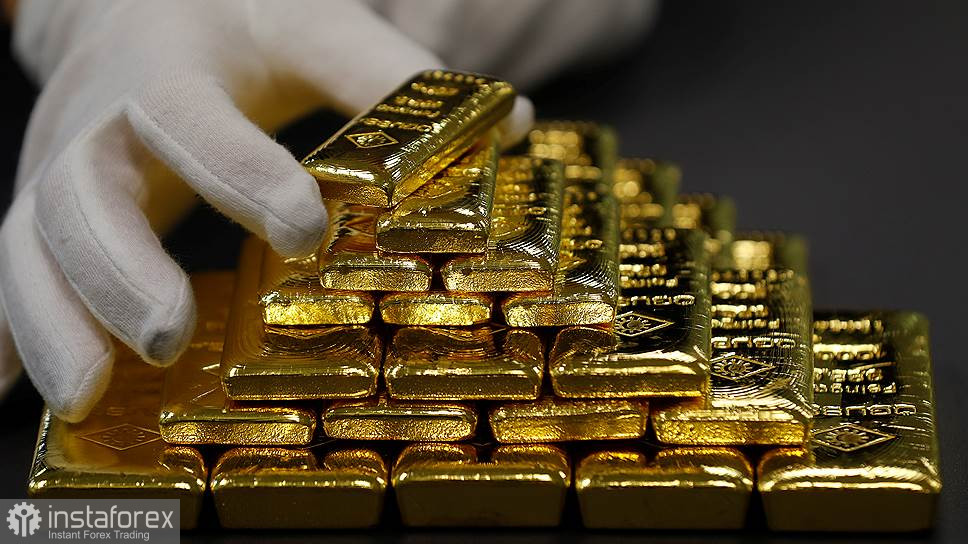
The cause for panic was the resumption of exchanges of strikes between the U.S. and Iran, the first in almost a month. U.S. forces attacked an island in the Strait of Hormuz, and the Islamic Republic retaliated with strikes on the United Arab Emirates and Jordan. Notably, for gold, this escalation operates through a contradictory mechanism: on one hand, it raises the geopolitical premium, while on the other, it drives up energy prices, thereby increasing pressure on the Federal Reserve to raise interest rates, which is traditionally negative for non-yielding metals.
It should be noted that the strikes highlight the ongoing unresolved nature of the main dispute. Washington and Tehran remain at odds over the status of the strait after more than six months of conflict that has shaken energy markets.
Meanwhile, the metal's performance in August remains outstanding. Gold gained almost 10 percent over the month, marking its largest monthly increase since January, fueled by the unexpected announcement from the U.S. Treasury in mid-month regarding increased bond repurchases. However, this was overshadowed by Kevin Warsh's speech, during which the Fed chair promised to combat inflation. Immediately afterward, traders priced in a more than 60 percent probability of an interest rate hike at the upcoming meeting on September 15-16, causing the metal to fall below the 200-day moving average, often viewed as a significant momentum indicator. Additionally, crossing this boundary earlier in August was considered a confirmation of the strength of the recovery, so a return below it signifies a technical breakdown.
We find ourselves in a situation where gold is caught between two equally powerful forces. The hawkish Fed and rising odds of a September rate hike work directly against the metal via the rate channel, while geopolitical escalation and the bond repurchase program starting September 9 support it via the risk premium and the theme of devaluation.
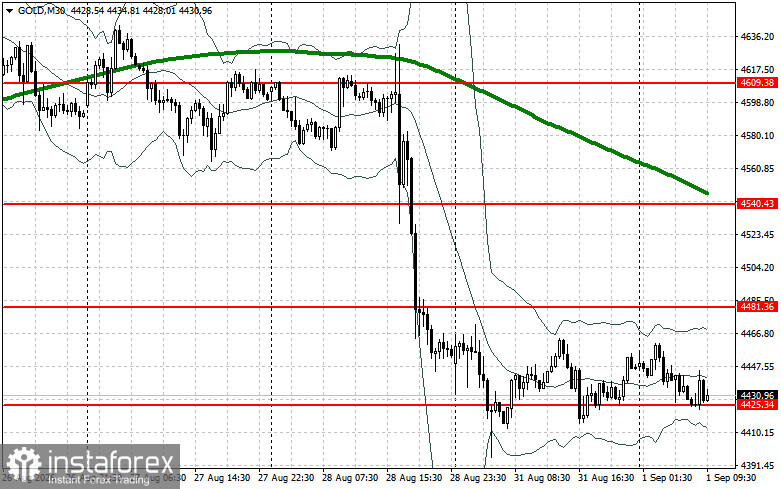
As for the current technical picture of gold, buyers need to reclaim the nearest resistance at $4,481. This will allow them to target $4,540, above which it will be quite difficult to break through. The furthest target will be the $4,609 area. In the event of a decline, bears will attempt to take control of $4,425. If they succeed, breaking this range will deliver a serious blow to bulls' positions and could push gold down to a low of $4,372, with the potential to reach $4,304.
* Analisis pasaran yang disiarkan di sini adalah bertujuan untuk meningkatkan kesedaran anda, tetapi tidak untuk memberi arahan untuk membuat perdagangan.
Kajian analisis InstaSpot akan membuat anda mengetahui sepenuhnya aliran pasaran! Sebagai pelanggan InstaSpot, anda disediakan sejumlah besar perkhidmatan percuma untuk dagangan yang cekap.


