




Legenda dalam pasukan InstaSpot!
Legenda! Anda fikir ia adalah satu retorik yang besar? Tetapi bagaimana untuk kita memanggil seorang lelaki, yang telah menjadi pemain Asia pertama yang memenangi kejohanan catur dunia junior pada usia 18 tahun dan menjadi Grandmaster India pertama pada usia 19 tahun? Itulah permulaan yang sukar untuk merangkul gelaran Juara Dunia untuk Viswanathan Anand, seorang juara yang telah menjadi sebahagian daripada sejarah catur. Kini satu lagi legenda dalam pasukan InstaSpot!





Borussia adalah salah satu kelab bola sepak paling terkemuka di Jerman, yang telah berulang kali membuktikan kepada peminatnya: semangat persaingan dan kepemimpinan pasti akan membawa kepada kejayaan. Berdagang dengan cara yang sama seperti atlet sukan profesional beraksi menentang lawan: yakin dan aktif. Simpan "hantaran" dari Borussia FC dan menjadi pedagang hebat dengan InstaSpot!

South Korea's KOSPI tumbled by more than 10% on Tuesday amid a broad semiconductor sell-off. Trading was halted after the index hit a session low, with Samsung Electronics and SK Hynix plunging sharply.
Investors aggressively reduced exposure to chip stocks on concerns that rising competition from Chinese AI startups and domestic chip producers threatens the market positions of global leaders that had benefited from the AI rally.
A short-lived surge in sector stocks followed the record IPO of China's memory maker CXMT on the Shanghai exchange, but that momentum quickly faded.
Pressure intensified after reports that China had begun development of deep-UV (DUV) lithography machines — a development that stoked fears of a structural increase in competition.
On Wall Street, Monday's session closed mixed: the S&P 500 gained just under 0.1%, the Dow Jones rose by 0.5%, while the Nasdaq Composite slipped by 0.2%, marking its fourth consecutive down session.
Nvidia fell by nearly 5%, and Apple briefly reclaimed the title of the world's most valuable public company. AMD dropped by more than 5%, and memory producers suffered material losses.
The Nasdaq Composite closed yesterday at 24,932, below the lower Bollinger band (25,008) and in oversold territory.
The price is currently below the Ichimoku cloud (25,607–25,982) and the SuperTrend (26,070), confirming selling pressure.
A distribution top has completed on the chart — the structure has turned down.
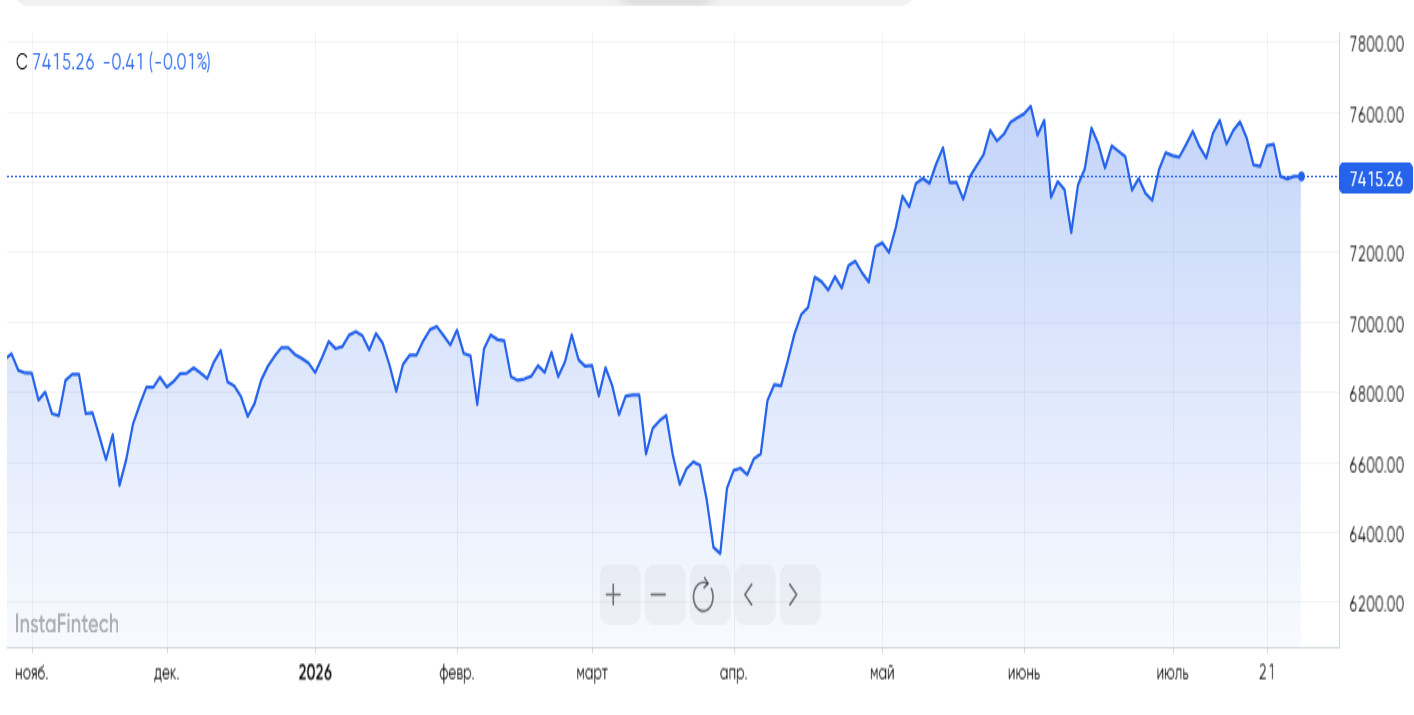
A close below 24,900 would accelerate the decline to the 200-day MA, while a break below 23,953 would confirm full-scale bull capitulation.
The market is under pressure: technical indicators confirm seller dominance, but support in the 23,875–23,953 area and a bullish monthly signal leave room for short-term bounces. The next technical tests to watch are 24,900 and 23,953 — breaks of these levels would likely define the next phase of the move.
Kajian analisis InstaSpot akan membuat anda mengetahui sepenuhnya aliran pasaran! Sebagai pelanggan InstaSpot, anda disediakan sejumlah besar perkhidmatan percuma untuk dagangan yang cekap.


