


Kumpulan kami mempunyai lebih daripada 7,000,000 pedagang!
Setiap hari kami bekerjasama untuk meningkatkan perdagangan. Kami mendapat keputusan yang tinggi dan bergerak ke hadapan.
Pengiktirafan oleh berjuta-juta pedagang di seluruh dunia adalah penghargaan terbaik untuk kerja kami! Anda membuat pilihan anda dan kami akan melakukan segalanya yang diperlukan untuk memenuhi jangkaan anda!
Kami adalah kumpulan yang terbaik bersama!
InstaSpot. Berbangga bekerja untuk anda!


Pelakon, juara kejohanan UFC 6 dan seorang wira sebenar!
Lelaki yang membuat dirinya sendiri. Lelaki yang mengikut cara kami.
Rahsia di sebalik kejayaan Taktarov adalah pergerakan berterusan ke arah matlamat.
Dedahkan semua segi bakat anda!
Cari, cuba, gagal - tetapi tidak pernah berhenti!
InstaSpot. Kisah kejayaan anda bermula di sini!

The EUR/USD currency pair fell sharply on Wednesday, like a stone. While we cannot conclude that such a drop was entirely expected, there were grounds for a significant strengthening of the U.S. dollar. The question is whether the U.S. dollar will continue to rise. Last night, the Federal Reserve essentially showed its willingness to raise rates at least once before the end of the year. The sentiment among members of the Monetary Policy Committee has become much more hawkish than at the meeting three months ago. However, what is surprising about the Fed preparing for a rate hike? This is exactly what the market had been anticipating in recent weeks amid rising inflation. At this point, it remains unclear whether there will be a need to tighten monetary policy in the U.S., as it depends on how inflation responds to the reopening of the Strait of Hormuz and falling oil prices. Oil prices have already fallen below $80 per barrel. Recall that before the war in Iran, Brent was valued at $70. Therefore, we believe that nothing extraordinary happened last night. The Fed did not raise the key rate; it merely ALLOWED for a potential increase.
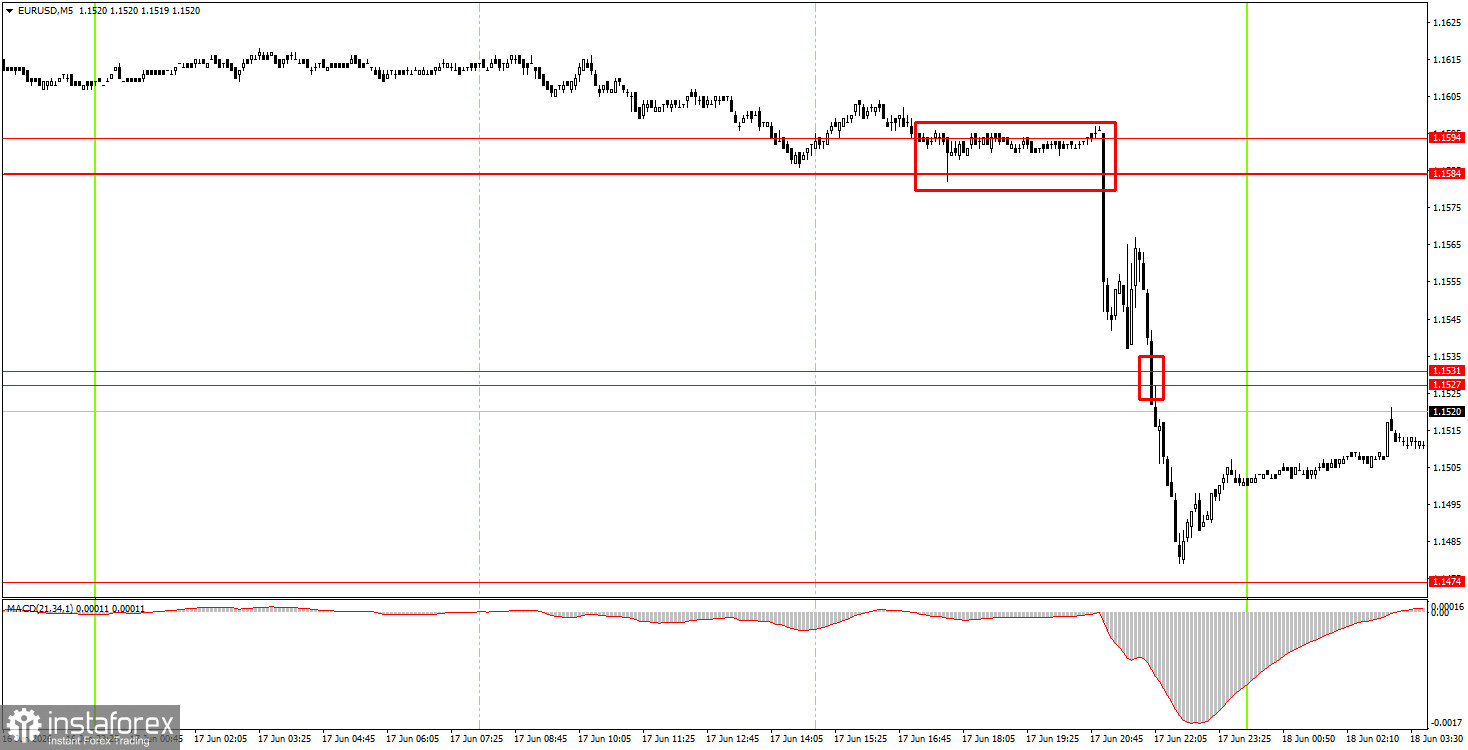
On the 5-minute timeframe, two trading signals were formed on Wednesday, both occurring after the FOMC meeting. First, the pair broke through the 1.1584-1.1594 area, then the 1.1527-1.1531 area. Thus, novice traders had two opportunities to open short positions. In any case, the short position yielded a good profit as the price literally plummeted by 120 pips within a couple of hours.
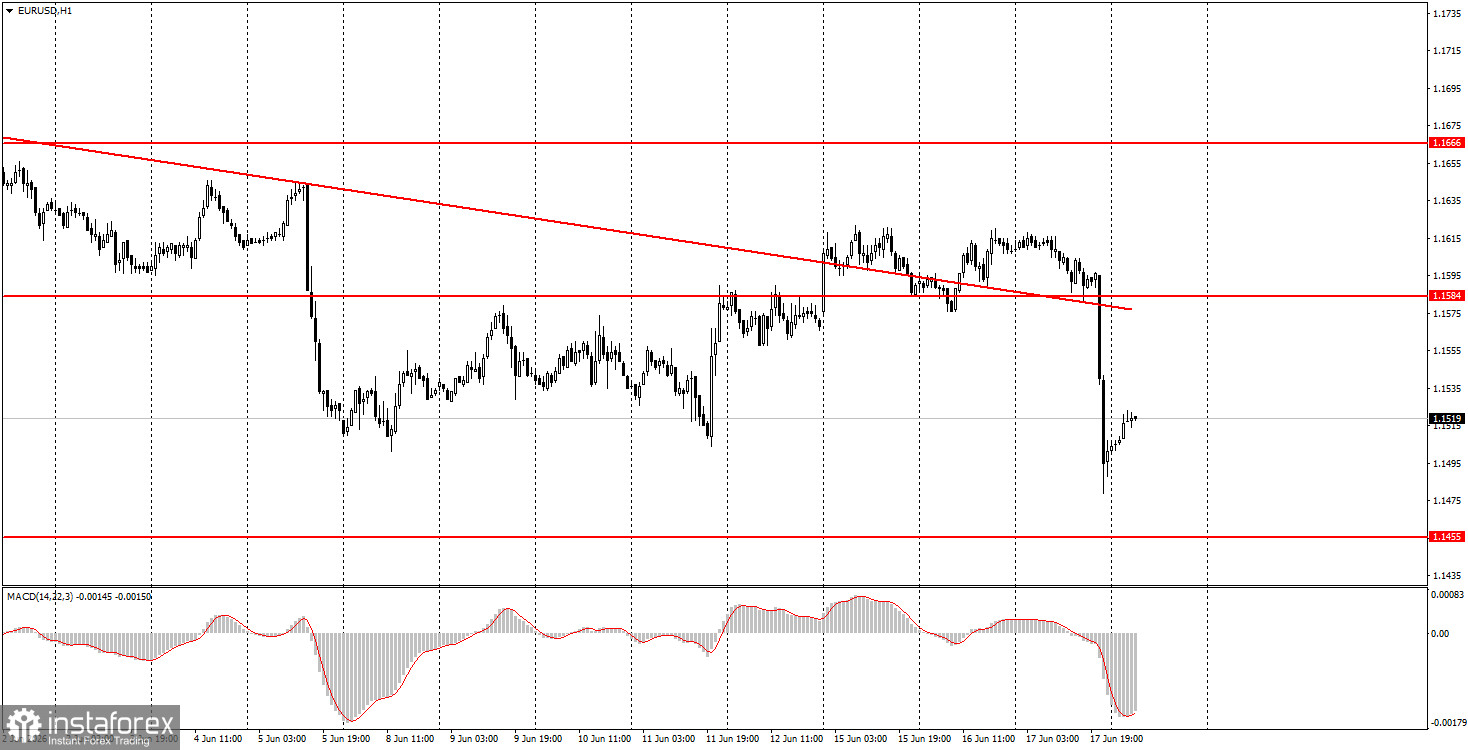
On the hourly timeframe, the downward trend has resumed, but only due to the strong support from the Fed. The U.S. dollar will not receive such boosts every day. If a ceasefire between Iran and the U.S. is signed on Friday, there will be one less reason for the market to buy the U.S. dollar. Also, the Fed is not the only central bank considering rate hikes.
On Thursday, novice traders may open short positions targeting 1.1465-1.1474 if the price bounces from the 1.1527-1.1531 area. Long positions can be established targeting 1.1584-1.1594 if price surpasses the 1.1527-1.1531 area.
On the 5-minute timeframe, levels to consider include 1.1354-1.1363, 1.1413, 1.1455-1.1474, 1.1527-1.1531, 1.1584-1.1594, 1.1655-1.1666, 1.1745-1.1754, 1.1830-1.1837, 1.1899-1.1908. On Thursday, no important data is scheduled in either the EU or the U.S., but the Bank of England's meeting may significantly impact the British pound, which correlates with the European currency. Therefore, we could expect a rather volatile day ahead.
Price levels (areas) of support and resistance are targets when opening long or short positions or sources of signals.
Red lines indicate channels or trend lines that display the current trend and indicate the preferred direction for trading.
The MACD indicator (14,22,3) – histogram and signal line – is a supplementary indicator that can also be used as a source of signals.
Important speeches and reports (contained in the news calendar) can significantly impact the movement of the currency pair. Therefore, during their release, trading should be conducted with maximum caution, or one should exit the market to avoid sharp reversals against preceding movements.
Beginners trading in the forex market should remember that not every trade can be profitable. Developing a clear strategy and practicing money management are key to long-term success in trading.
* Analisis pasaran yang disiarkan di sini adalah bertujuan untuk meningkatkan kesedaran anda, tetapi tidak untuk memberi arahan untuk membuat perdagangan.
Kajian analisis InstaSpot akan membuat anda mengetahui sepenuhnya aliran pasaran! Sebagai pelanggan InstaSpot, anda disediakan sejumlah besar perkhidmatan percuma untuk dagangan yang cekap.


