




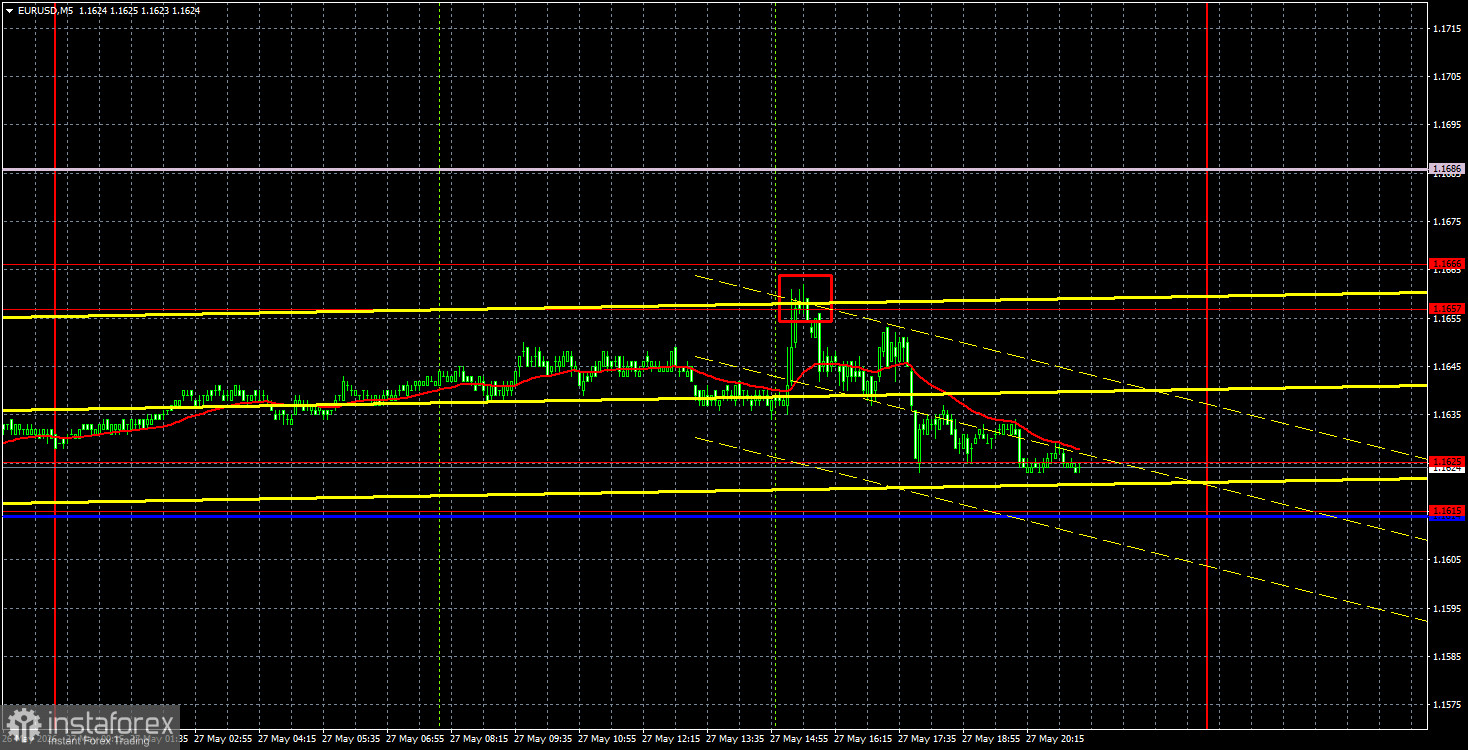
Pasangan mata wang EUR/USD memulakan minggu baharu dengan lonjakan yang agak kukuh; namun pasaran kemudiannya kembali tenang dan bergerak dalam saluran mendatar selama tiga hari berturut-turut, dihadkan oleh dua zon: 1.1615–1.1625 dan 1.1657–1.1666. Oleh itu, dapat disimpulkan bahawa formasi mendatar sedang terbentuk. Apakah punca pergerakan mendatar ini? Latar belakang makroekonomi agak tenang minggu ini dan faktor asas tidak menyokong pergerakan jelas. Setiap hari muncul banyak berita geopolitik yang sering bercanggah antara satu sama lain. Akibatnya, pasaran tidak tergesa-gesa bertindak balas terhadap setiap berita baharu kerana menyedari kebarangkalian bahawa sebahagian besar maklumat tersebut tidak tepat. Dengan demikian, minggu ini tiada pemangkin jelas bagi pasaran. Gencatan senjata, rundingan dan potensi perjanjian antara Amerika Syarikat dan Iran masih tergantung tanpa kepastian, dan pasaran sukar menilai kebarangkalian hasil yang positif.
Dari sudut teknikal, aliran menurun masih berterusan. Harga berada di bawah garis Senkou Span B dan garisan aliran menaik belum terbentuk. Oleh itu, aliran menurun hanya akan dianggap tamat selepas harga berjaya menembusi dan menutup di atas garis Senkou Span B. Tanpa pemeteraian memorandum antara Teheran dan Washington, mata wang euro sukar menembusi serta kekal di atas tahap tersebut.
Pada carta masa lima minit, isyarat jualan pertama timbul semasa sesi dagangan Amerika Syarikat apabila harga membuat lantunan daripada zon 1.1657–1.1666. Dalam tempoh beberapa jam, harga berjaya mencecah zon 1.1615–1.1625. Selain itu, pada hari Selasa isyarat beli muncul selepas lantunan daripada zon 1.1615–1.1625, yang turut memberikan keuntungan kepada pedagang. Walaupun pasaran bergerak secara mendatar, dua urus niaga dapat dibuka dan kedua-duanya mencatatkan pulangan positif.
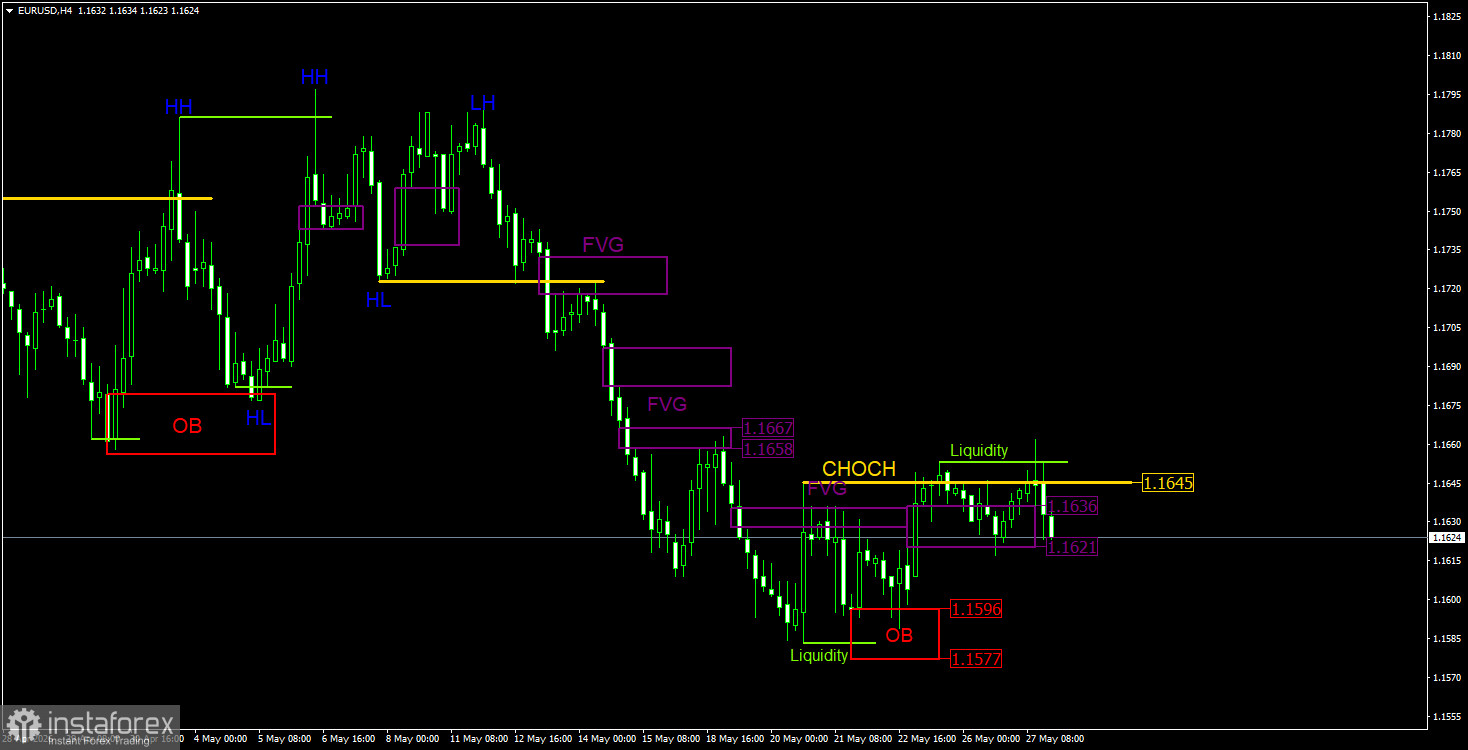
Pada carta 4 jam dalam metodologi dagangan ICT, harga telah menghasilkan isyarat beli dalam blok pesanan menaik minggu lalu. Pada hari Isnin, FVG menaik baharu terbentuk dan mencetuskan reaksi harga. Bagaimanapun, pada hari Selasa, keadaan geopolitik kembali merosot dengan ketara, dan pemeteraian memorandum yang dibincangkan oleh Trump setiap satu setengah jam sekali sekali lagi berdepan risiko kegagalan. Oleh itu, kenaikan selanjutnya bagi mata wang euro tidak berlaku. Pada masa ini, tiada corak baharu, dan garisan CHoCH masih belum ditembusi untuk menamatkan aliran menurun.
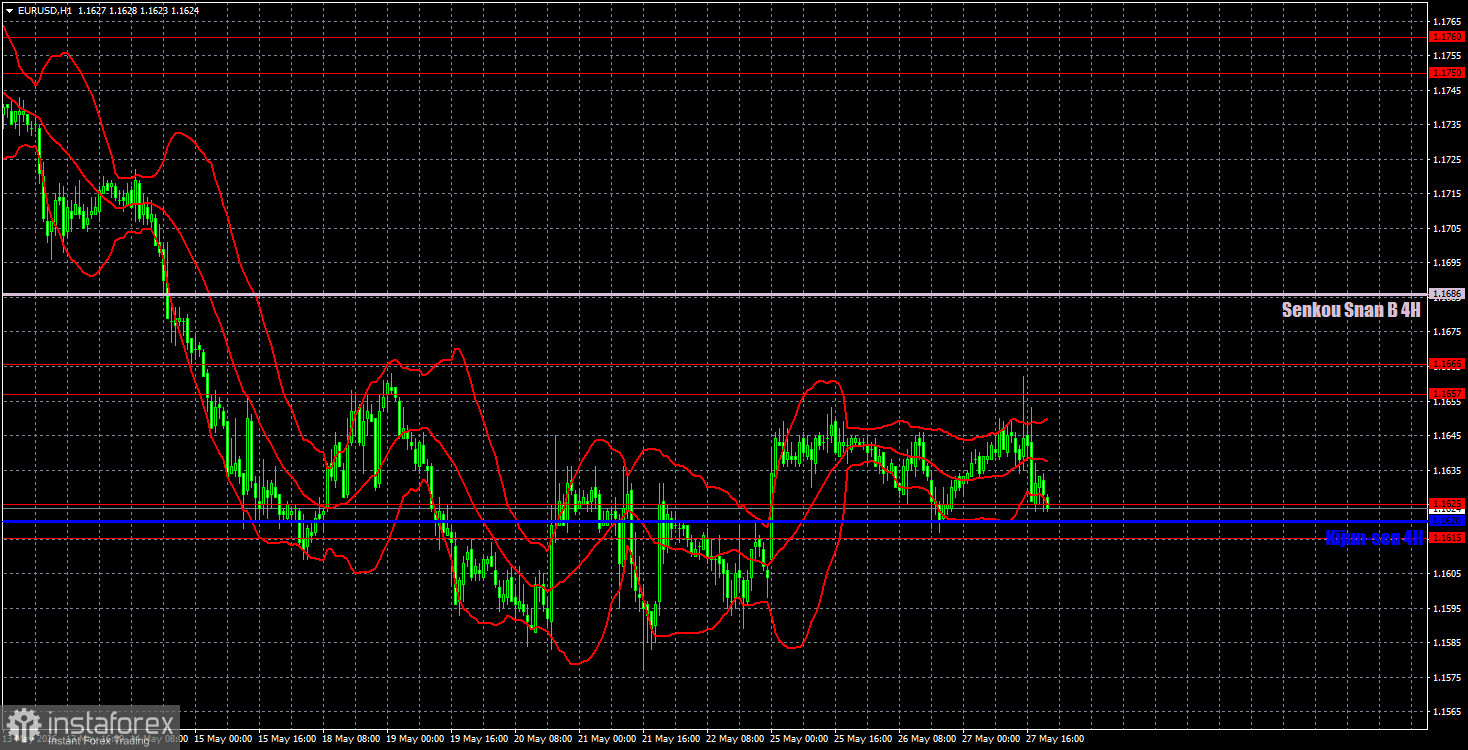
Pada carta masa satu jam, pasangan EUR/USD terus membentuk aliran menurun. Keadaan di Timur Tengah kekal tegang tetapi tidak bertambah buruk, dan secara teori Washington serta Teheran mungkin akan menandatangani suatu perjanjian awal. Sekiranya tiada petanda baharu peningkatan ketegangan di Timur Tengah dan memorandum itu benar‑benar ditandatangani, dolar berkemungkinan akan mula kehilangan kekuatan. Namun, ketika ini kita menyaksikan keadaan yang berlawanan.
Bagi 28 Mei, kami menyerlahkan tahap‑tahap berikut untuk dagangan: 1.1362, 1.1426, 1.1542, 1.1615–1.1625, 1.1657–1.1666, 1.1750–1.1760, 1.1786, 1.1830–1.1837, 1.1907–1.1922, serta garisan Senkou Span B (1.1686) dan Kijun‑sen (1.1620). Garis‑garis penunjuk Ichimoku boleh berubah sepanjang hari, dan perkara ini perlu diambil kira ketika menentukan isyarat dagangan. Jangan lupa mengalihkan pesanan henti rugi (SL) anda ke paras pulang modal sekiranya harga bergerak mengikut arah yang betul sebanyak 15 pip. Langkah ini akan melindungi anda daripada potensi kerugian sekiranya isyarat terbabit adalah palsu.
Pada hari Khamis, Christine Lagarde akan berucap di Zon Euro — ini merupakan acara utama pertama minggu ini. Di Amerika Syarikat, laporan mengenai pesanan barangan tahan lama dan Perbelanjaan Penggunaan Peribadi Teras (PCE teras) akan diterbitkan. Kami tidak menyifatkan laporan‑laporan ini sebagai amat penting; kemungkinan besarnya, ia tidak akan menyebabkan berakhirnya pergerakan mendatar semasa.
Hari ini, pedagang boleh membuka kedudukan jual dengan sasaran pada 1.1542 sekiranya harga menyatu di bawah kawasan 1.1615–1.1625. Kedudukan beli boleh dibuka sekiranya harga membuat lantunan daripada kawasan 1.1615–1.1625, dengan sasaran pada kawasan 1.1657–1.1666 dan garis Senkou Span B. Pada carta masa 4 jam, tiada corak yang relevan, dan situasi semasa pada carta masa setiap jam adalah mendatar.
* Analisis pasaran yang disiarkan di sini adalah bertujuan untuk meningkatkan kesedaran anda, tetapi tidak untuk memberi arahan untuk membuat perdagangan.
Kajian analisis InstaSpot akan membuat anda mengetahui sepenuhnya aliran pasaran! Sebagai pelanggan InstaSpot, anda disediakan sejumlah besar perkhidmatan percuma untuk dagangan yang cekap.










