


Kumpulan kami mempunyai lebih daripada 7,000,000 pedagang!
Setiap hari kami bekerjasama untuk meningkatkan perdagangan. Kami mendapat keputusan yang tinggi dan bergerak ke hadapan.
Pengiktirafan oleh berjuta-juta pedagang di seluruh dunia adalah penghargaan terbaik untuk kerja kami! Anda membuat pilihan anda dan kami akan melakukan segalanya yang diperlukan untuk memenuhi jangkaan anda!
Kami adalah kumpulan yang terbaik bersama!
InstaSpot. Berbangga bekerja untuk anda!


Pelakon, juara kejohanan UFC 6 dan seorang wira sebenar!
Lelaki yang membuat dirinya sendiri. Lelaki yang mengikut cara kami.
Rahsia di sebalik kejayaan Taktarov adalah pergerakan berterusan ke arah matlamat.
Dedahkan semua segi bakat anda!
Cari, cuba, gagal - tetapi tidak pernah berhenti!
InstaSpot. Kisah kejayaan anda bermula di sini!

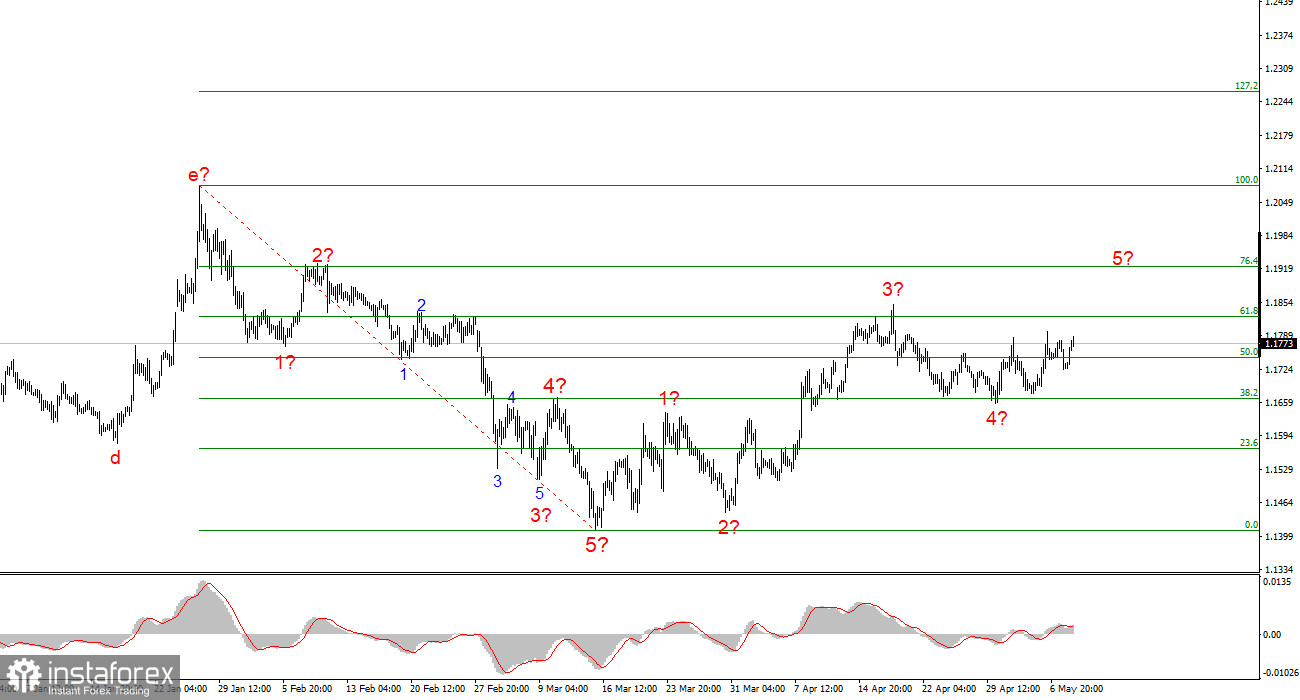
The wave pattern on the 4-hour chart for EUR/USD has changed. There is still no reason to speak about the cancellation of the upward trend segment (lower chart), which began in January of last year, but the trend structure now looks highly ambiguous. In such situations, I always recommend switching to a lower timeframe (upper chart) and analyzing the simplest and smallest wave structures in order to make a short-term forecast, which is usually sufficient for opening trades. Wave structures can be extremely complex and may imply multiple possible scenarios. The easiest approach is to trade standard "five-three" patterns.
In the chart above, I can identify a classic five-wave impulse structure with an extended third wave. After the completion of this structure, the market began forming a corrective sequence consisting of at least three waves. We have already seen three waves, which means the market is likely to form at least one more corrective downward wave in the near future. Further developments will depend on geopolitics: either the upward structure becomes more complex, or a new downward trend segment begins.
The EUR/USD pair rose by 50 basis points on Friday, despite a highly contradictory news backdrop throughout the day.
To begin with, Iran and the United States exchanged missile strikes yesterday, once again casting doubt on future negotiations and the possibility of reaching a peace agreement. However, the following day (today), both Tehran and Washington made official statements confirming that negotiations are continuing and that the latest escalation will not affect them. Consequently, both sides appear committed to resolving the conflict rather than escalating it further, although each side continues responding to what it considers unfair actions by the other.
Apparently, this understanding once again worked against the U.S. dollar and against EUR/USD sellers. Yesterday evening, demand for the dollar increased, but today it declined sharply again.
Today also brought U.S. labor market and unemployment data. Many market participants expected another disappointing Nonfarm Payrolls report, but that did not happen. The number of new nonfarm jobs created in April totaled 115,000, significantly exceeding market expectations of 62,000. The unemployment rate remained unchanged, average wages increased by 3.6% (slightly below forecasts), while the University of Michigan Consumer Sentiment Index came in weaker than expected at 48.2 versus 49.5.
Thus, the consumer sentiment index may have pressured the dollar lower, but few would dispute that Nonfarm Payrolls is far more important. And this report should have supported the U.S. currency.
The conclusion? The market once again ignored economic data in favor of geopolitics.
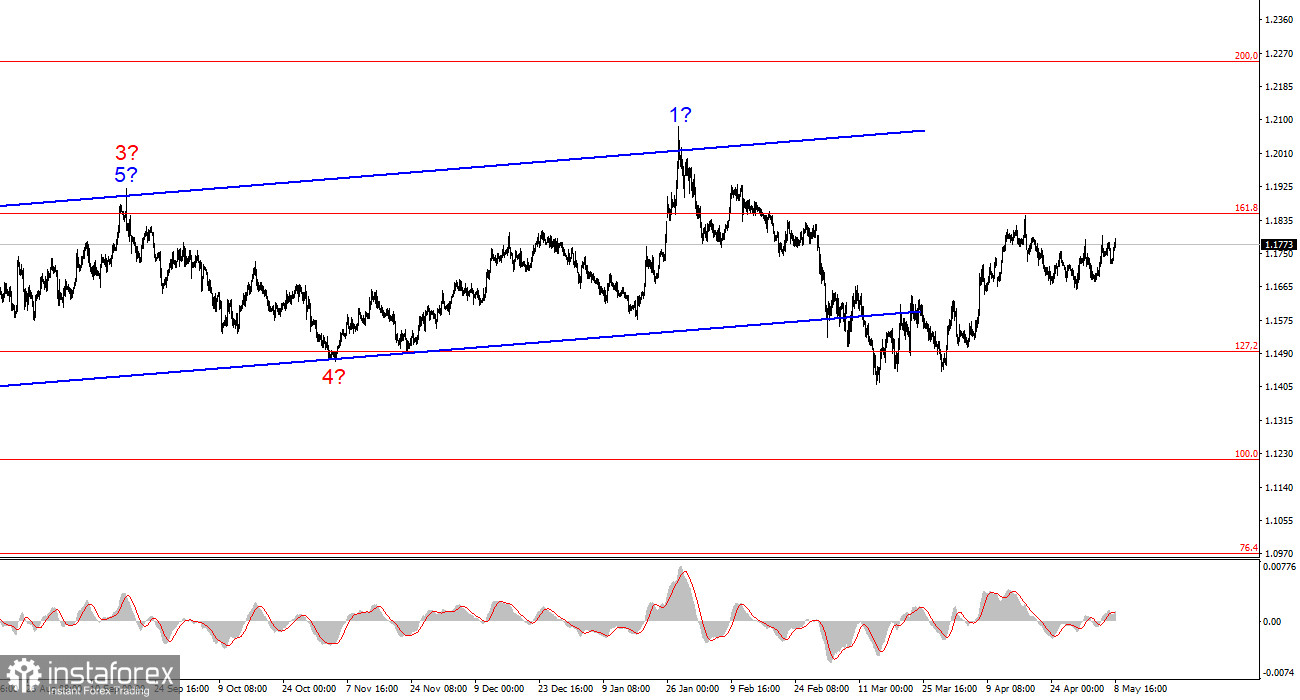
Based on the EUR/USD analysis, I conclude that the instrument remains within a broader upward trend segment (lower chart) and, in the short term, within a corrective structure. The corrective wave sequence appears largely complete and may only become more complex and prolonged if the geopolitical situation in the Middle East continues to improve. Otherwise, a new downward trend segment could begin from current levels.
We have already seen the corrective wave, and I expect the pair to resume its upward movement from current levels, targeting the area around the 1.1900 level.
On the smaller timeframe, the entire upward trend segment is visible. The wave structure is somewhat unconventional, as the corrective waves vary considerably in size. For example, the larger wave 2 is smaller than the internal wave 2 within wave 3. However, such situations do occur. I would also remind traders that it is best to focus on identifying clear and understandable structures on charts rather than attempting to label every single wave. The most recent waves are difficult to identify precisely, which is why my analysis relies more heavily on the higher timeframe.
* Analisis pasaran yang disiarkan di sini adalah bertujuan untuk meningkatkan kesedaran anda, tetapi tidak untuk memberi arahan untuk membuat perdagangan.
Kajian analisis InstaSpot akan membuat anda mengetahui sepenuhnya aliran pasaran! Sebagai pelanggan InstaSpot, anda disediakan sejumlah besar perkhidmatan percuma untuk dagangan yang cekap.


