


Kumpulan kami mempunyai lebih daripada 7,000,000 pedagang!
Setiap hari kami bekerjasama untuk meningkatkan perdagangan. Kami mendapat keputusan yang tinggi dan bergerak ke hadapan.
Pengiktirafan oleh berjuta-juta pedagang di seluruh dunia adalah penghargaan terbaik untuk kerja kami! Anda membuat pilihan anda dan kami akan melakukan segalanya yang diperlukan untuk memenuhi jangkaan anda!
Kami adalah kumpulan yang terbaik bersama!
InstaSpot. Berbangga bekerja untuk anda!


Pelakon, juara kejohanan UFC 6 dan seorang wira sebenar!
Lelaki yang membuat dirinya sendiri. Lelaki yang mengikut cara kami.
Rahsia di sebalik kejayaan Taktarov adalah pergerakan berterusan ke arah matlamat.
Dedahkan semua segi bakat anda!
Cari, cuba, gagal - tetapi tidak pernah berhenti!
InstaSpot. Kisah kejayaan anda bermula di sini!

Bitcoin continues a kind of upward movement that is a correction and has lasted about a month and a half. On the daily TF, this is clearly visible. There is a liquidity pool below that price is likely to visit with about 90% probability. On the 4?hour TF, you can see how slowly Bitcoin is rising, if it is rising at all. A fast, sharp fall combined with slow, soft gains are classic signs of a downtrend. Thus, our view remains unchanged — the downtrend is not finished; the market is in a pause.
Meanwhile, Wall Street Journal analysts suggested that Bitcoin could reach $1 million by 2033. They noted that a 30% correction did not trigger a large institutional outflow — ETF outflows were only about 5%. It's hard to say which correction they mean, given that over the past six months Bitcoin has lost more than 50% of its value, and that may not be the end. Wall Street Journal forecasts $150,000 in 2026 and $200,000 in 2027; at that pace, "digital gold" could hit $1 million by 2033.
The analysts also said that the 50% drop from last year's high was the weakest "bear" market in Bitcoin's history. We have only one question: who said the bear trend is over? Let me remind you that there are currently no technical signs of a completed downtrend, and all of Bitcoin's sluggish gains over the past month and a half have the hallmarks of a correction. The Wall Street Journal believes the current cycle is not the classic four-year, halving-tied cycle. In their view, the bull cycle has been stretched out by high and persistent institutional demand. Retail traders remain panicky, but large players are supposedly offsetting them. In our view, the whales have not been able to offset retail sell-offs if Bitcoin fell 50% in six months.
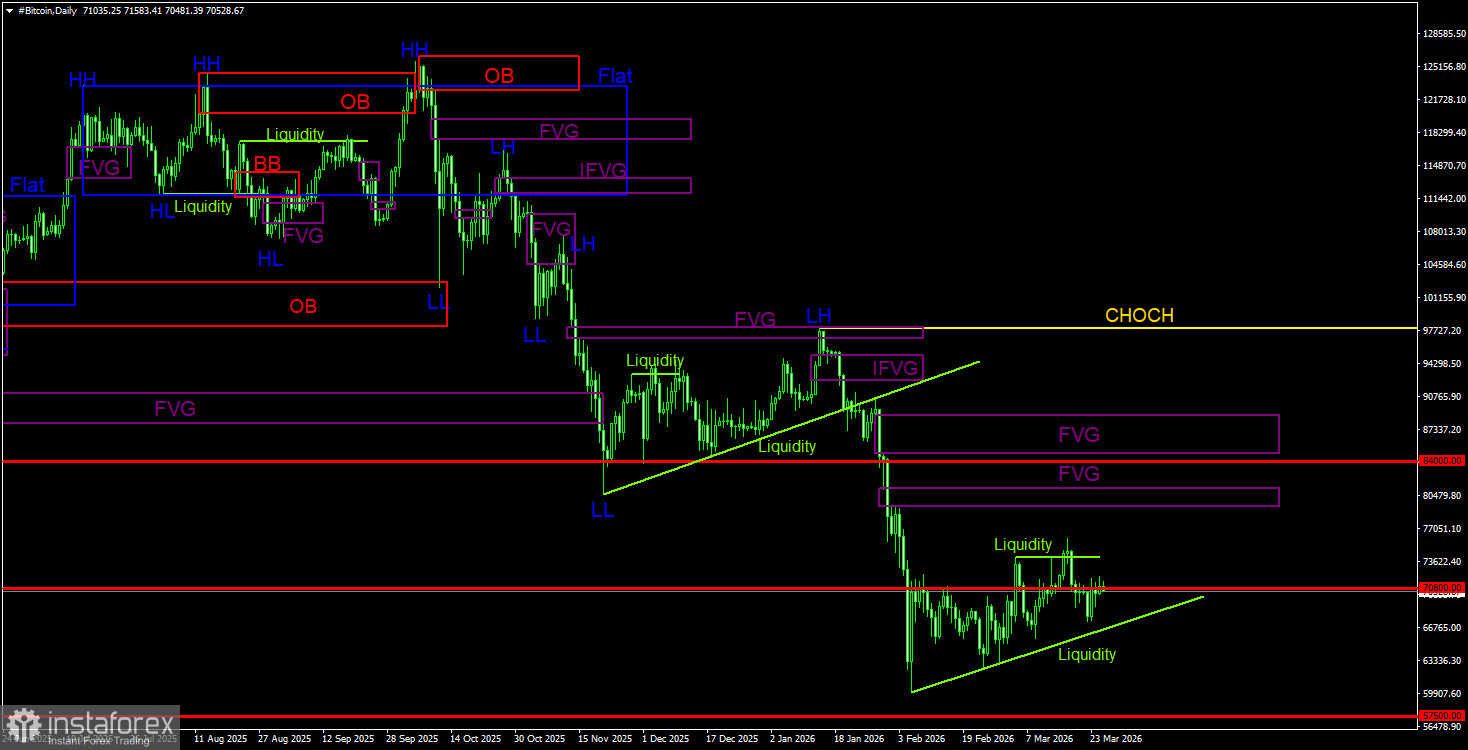
Bitcoin continues to form a full-fledged downtrend. We still expect a decline toward $57,500 (the 61.8% Fibonacci level of the three?year uptrend), and there are currently no signs of a trend reversal. Even $57,500 no longer looks like the final stop. From POI areas, note only the nearest bearish FVG on the daily TF, which sits quite far from the price. On the 4-hour TF, Bitcoin's price action shows all the hallmarks of a range. Down below, an obvious target remains — the liquidity pool beneath the daily-TF trendline.
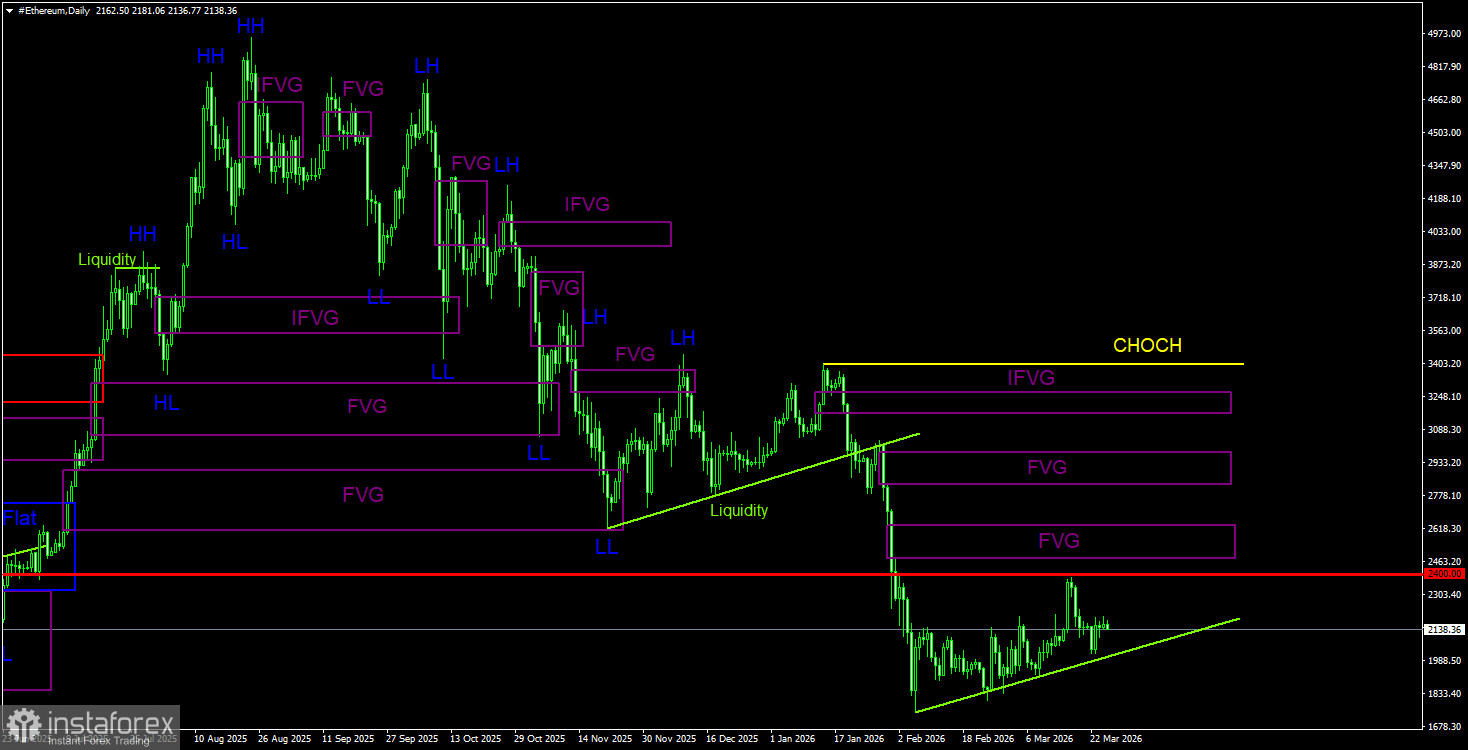
The downtrend is progressing on the daily TF. The key sell pattern has been and remains the bearish order block on the weekly TF. As we warned, the move triggered by that signal can be strong and prolonged. Since that pattern formed, Ethereum has already slumped about 55% (roughly $2,500). An upside correction is still possible in the near term; the 4?hour order block has been invalidated, and the coin has left the sideways channel. On Monday, a bullish FVG formed on the 4?hour TF, and the price reacted to it, so the rally may continue toward a bearish FVG, from which a new leg of decline could begin.
CHOCH — change of character / break of the trend structure. Liquidity — liquidity, traders' Stop?Losses that market?makers use to build their positions. FVG — Fair Value Gap (area of price inefficiency). The price often moves quickly through such areas, indicating the absence of one side in the market. Later, the price tends to return and react to these zones. IFVG — Inverted Fair Value Gap. After a return to such a zone, the price does not react but impulsively breaks through and then tests it from the other side.
OB — Order Block. A candle on which a market?maker opened a position in order to harvest liquidity and then form their own position in the opposite direction.
* Analisis pasaran yang disiarkan di sini adalah bertujuan untuk meningkatkan kesedaran anda, tetapi tidak untuk memberi arahan untuk membuat perdagangan.
Kajian analisis InstaSpot akan membuat anda mengetahui sepenuhnya aliran pasaran! Sebagai pelanggan InstaSpot, anda disediakan sejumlah besar perkhidmatan percuma untuk dagangan yang cekap.


