


Kumpulan kami mempunyai lebih daripada 7,000,000 pedagang!
Setiap hari kami bekerjasama untuk meningkatkan perdagangan. Kami mendapat keputusan yang tinggi dan bergerak ke hadapan.
Pengiktirafan oleh berjuta-juta pedagang di seluruh dunia adalah penghargaan terbaik untuk kerja kami! Anda membuat pilihan anda dan kami akan melakukan segalanya yang diperlukan untuk memenuhi jangkaan anda!
Kami adalah kumpulan yang terbaik bersama!
InstaSpot. Berbangga bekerja untuk anda!


Pelakon, juara kejohanan UFC 6 dan seorang wira sebenar!
Lelaki yang membuat dirinya sendiri. Lelaki yang mengikut cara kami.
Rahsia di sebalik kejayaan Taktarov adalah pergerakan berterusan ke arah matlamat.
Dedahkan semua segi bakat anda!
Cari, cuba, gagal - tetapi tidak pernah berhenti!
InstaSpot. Kisah kejayaan anda bermula di sini!

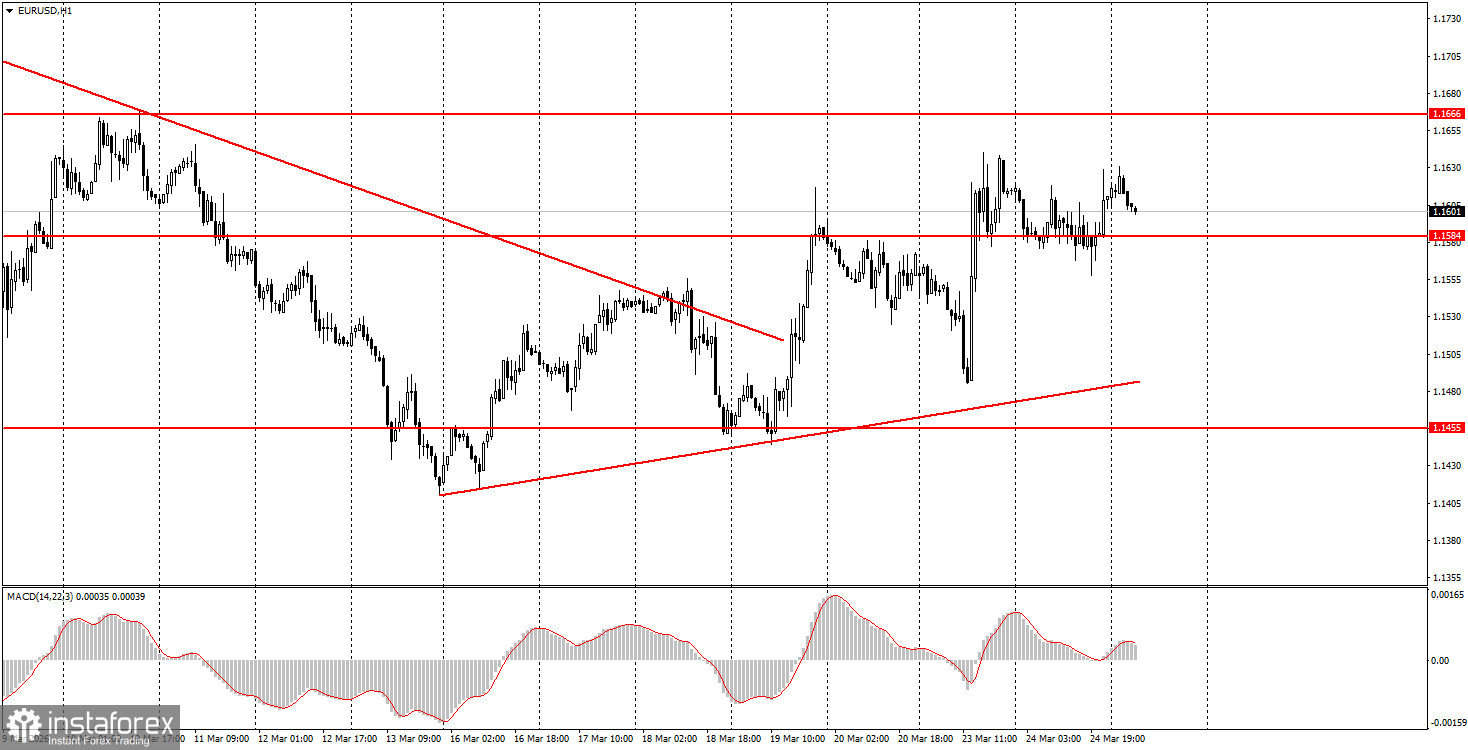
The EUR/USD currency pair struggled to determine its direction throughout Tuesday. Despite a relatively rich macroeconomic backdrop, traders awaited news from the Middle East. However, they did not receive any. Trump's statements on Monday about negotiations with Iran remain unconfirmed, but there is no complete denial of their existence. The information field is filled with insider reports from both the Iranian side and the Americans. However, there is practically no specificity. Thus, the upward trend on the hourly timeframe remains, but it is extremely weak and unstable. The US dollar could resume its rise at any time if the market realizes that the situation in the Middle East will not improve soon and that oil and gas prices will continue to rise. Business activity in the European Union showed mixed results in March, which did not add to traders' desire to trade actively on Tuesday.
On the hourly timeframe, the downward trend is complete, but we may be dealing with another simple upward correction. At the beginning of 2026, a long-term upward trend has resumed, so we still anticipate new medium-term growth for the euro currency. The overall fundamental background remains very challenging for the US dollar; however, geopolitical factors are currently of primary importance for the market. This is what prevents the dollar from falling.
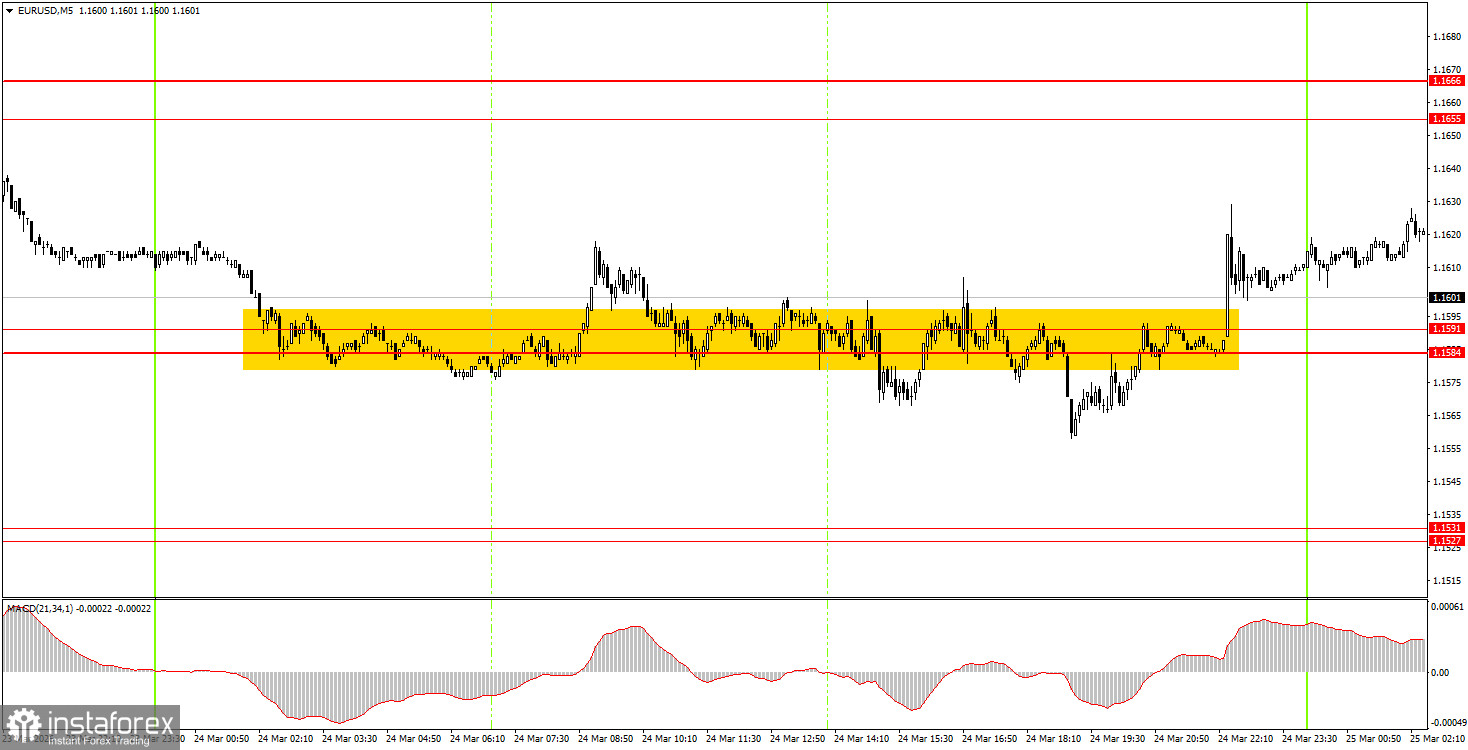
On Wednesday, beginner traders may consider short positions if the price consolidates below the 1.1584-1.1591 range, targeting 1.1527-1.1531. A bounce from the area of 1.1584-1.1591 would allow for opening long positions with targets at 1.1655-1.1666.
On the 5-minute timeframe, the following levels should currently be monitored: 1.1267-1.1292, 1.1354-1.1363, 1.1413, 1.1455-1.1474, 1.1527-1.1531, 1.1584-1.1591, 1.1655-1.1666, 1.1745-1.1754, 1.1830-1.1837, 1.1899-1.1908. On Wednesday, ECB President Christine Lagarde will speak in the Eurozone, but this event is unlikely to be significant given the ECB's meeting last week. The ECB provided all necessary information to the market, so it is unlikely that Lagarde will announce anything important or interesting today.
Price levels of support and resistance are levels that serve as targets when opening buys or sells. Take Profit levels can be placed around them.
Red lines represent channels or trend lines that show the current trend and indicate the direction in which it is preferable to trade now.
The MACD indicator (14,22,3) – the histogram and the signal line – is a supporting indicator that can also be used as a source of signals.
Important speeches and reports (always included in the news calendar) can significantly affect the movement of the currency pair. Therefore, during their release, trading should be done with utmost caution, or traders should exit the market to avoid sharp price reversals against the previous movement.
Beginning traders in the forex market should remember that not every trade can be profitable. Developing a clear strategy and effective money management are the keys to long-term trading success.
* Analisis pasaran yang disiarkan di sini adalah bertujuan untuk meningkatkan kesedaran anda, tetapi tidak untuk memberi arahan untuk membuat perdagangan.
Kajian analisis InstaSpot akan membuat anda mengetahui sepenuhnya aliran pasaran! Sebagai pelanggan InstaSpot, anda disediakan sejumlah besar perkhidmatan percuma untuk dagangan yang cekap.


