


Kumpulan kami mempunyai lebih daripada 7,000,000 pedagang!
Setiap hari kami bekerjasama untuk meningkatkan perdagangan. Kami mendapat keputusan yang tinggi dan bergerak ke hadapan.
Pengiktirafan oleh berjuta-juta pedagang di seluruh dunia adalah penghargaan terbaik untuk kerja kami! Anda membuat pilihan anda dan kami akan melakukan segalanya yang diperlukan untuk memenuhi jangkaan anda!
Kami adalah kumpulan yang terbaik bersama!
InstaSpot. Berbangga bekerja untuk anda!


Pelakon, juara kejohanan UFC 6 dan seorang wira sebenar!
Lelaki yang membuat dirinya sendiri. Lelaki yang mengikut cara kami.
Rahsia di sebalik kejayaan Taktarov adalah pergerakan berterusan ke arah matlamat.
Dedahkan semua segi bakat anda!
Cari, cuba, gagal - tetapi tidak pernah berhenti!
InstaSpot. Kisah kejayaan anda bermula di sini!

Untuk GBP/USD, kiraan gelombang terus menunjukkan pembentukan segmen aliran menaik (grafik bawah), walaupun dalam enam bulan yang lalu ia telah mengambil bentuk yang kompleks dan diperluas (grafik atas). Segmen aliran yang bermula pada 1 Julai boleh dianggap sebagai gelombang 4, atau mana-mana gelombang pembetulan global, kerana ia jelas mempunyai struktur gelombang dalaman yang bersifat pembetulan dan bukannya impulsif. Hal yang sama juga berlaku kepada sub-gelombang dalaman. Struktur gelombang menurun yang bermula pada 17 September telah mengambil bentuk lima gelombang a–b–c–d–e dan kini telah selesai. Pada masa ini, pasangan ini berada dalam tahap membentuk urutan gelombang menaik yang baharu.
Sudah tentu, sebarang struktur gelombang boleh menjadi lebih kompleks dan diperluas pada bila-bila masa. Bahkan gelombang 4 yang dianggap sedang terbentuk selama enam bulan ini boleh mengambil bentuk lima gelombang, dan dalam kes ini, kita akan menyaksikan pembetulan selama beberapa bulan lagi. Namun, pada masa ini, terdapat peluang yang baik untuk pembentukan urutan gelombang menaik. Jika ini benar, maka dua gelombang pertama segmen ini telah pun selesai, dan kini kita sedang menyaksikan perkembangan gelombang 3 atau C, yang mengambil bentuk dorongan dan memberikan harapan untuk sifat impulsif urutan gelombang semasa.
Pasangan GBP/USD naik sekitar 70–80 mata pada hari Isnin, yang mungkin membuatkan ramai peserta pasaran keliru. Minggu lalu, apabila pasaran menerima banyak maklumat yang sangat penting setiap hari, amplitud pergerakan harga adalah agak rendah. Minggu baharu bermula, kalendar ekonomi kelihatan lebih seperti padang pasir, banyak negara di seluruh dunia akan meraikan Krismas pada hari Jumaat, dan mata wang British tiba-tiba melonjak. Apakah yang sedang berlaku?
Pada pandangan saya, tiada apa yang luar biasa. Kiraan gelombang semasa terus menunjukkan segmen aliran menaik. Dan apa yang sepatutnya diharapkan daripada instrumen dalam aliran menaik jika bukan pertumbuhan? Hari ini, UK mengeluarkan laporan KDNK Q3; angka tersebut tidak mengecewakan dan sepadan dengan jangkaan pasaran. Ini adalah alasan yang agak lemah untuk pembelian aktif pound tersebut, tetapi saya ingin mengingatkan bahawa permintaan untuk mata wang Eropah juga meningkat hari ini. Oleh itu, kemungkinan besar, laporan KDNK bukanlah sebab utama.
Pasaran telah jenuh dengan pembelian dolar semasa "penutupan" dan pelonggaran dasar monetari Fed, yang pada dirinya sendiri kelihatan pelik. Pasangan GBP/USD membentuk gelombang pembetulan 4 yang diperluaskan, sesuatu yang jarang dijangka. Oleh itu, pasangan ini kini sedang meningkat dengan aktif kerana kiraan gelombang memerlukannya. Saya tidak meletakkan banyak harapan dalam teori "pasaran tidak aktif," tetapi saya membenarkan bahawa cuti 2026 mungkin membawa beberapa kejutan. Sebenarnya, kejutan telah pun bermula, kerana tiada siapa yang menjangkakan kekuatan sedemikian daripada pound British pada hari Isnin. Penembusan berjaya pada tahap 1.3450, yang bersamaan dengan 61.8% Fibonacci, akan menunjukkan kesediaan pasaran untuk terus membeli pound tersebut.
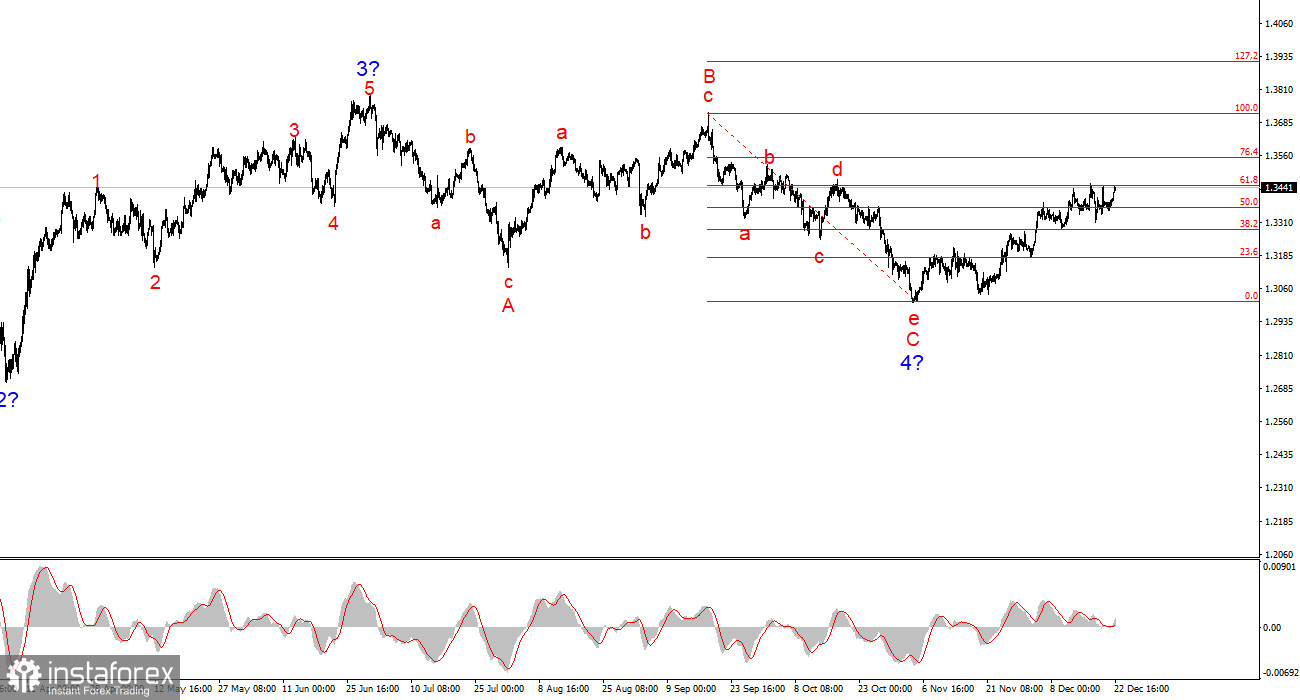
Gambar gelombang GBP/USD telah berubah. Struktur pembetulan menurun a–b–c–d–e dalam gelombang C gelombang 4 nampaknya telah selesai, seperti juga gelombang 4 secara keseluruhannya. Jika ini benar, saya menjangkakan segmen aliran utama akan meneruskan perkembangannya dengan sasaran awal sekitar tahap 38 dan 40.
Dalam jangka pendek, saya menjangkakan pembentukan gelombang 3 atau C dengan sasaran terletak berhampiran 1.3280 dan 1.3360, sepadan dengan tahap 76.4% dan 61.8% Fibonacci. Sasaran ini telah dicapai. Gelombang 3 atau C masih di dalam pembentukan, dan pada masa ini kita sedang melihat cubaan keempat untuk memecahkan tahap 1.3450, yang sepadan dengan tahap 61.8% Fibonacci.
Kiraan gelombang jangka masa yang lebih panjang kelihatan hampir ideal, walaupun gelombang 4 bergerak melebihi tinggi gelombang 1. Namun, saya ingin mengingatkan anda bahawa kiraan gelombang ideal hanya wujud dalam buku teks. Dalam amalan, segalanya lebih kompleks. Pada masa ini, saya tidak nampak sebab untuk mempertimbangkan pemandangan alternatif kepada segmen aliran menaik.
Prinsip Teras Analisis Saya:
* Analisis pasaran yang disiarkan di sini adalah bertujuan untuk meningkatkan kesedaran anda, tetapi tidak untuk memberi arahan untuk membuat perdagangan.
Kajian analisis InstaSpot akan membuat anda mengetahui sepenuhnya aliran pasaran! Sebagai pelanggan InstaSpot, anda disediakan sejumlah besar perkhidmatan percuma untuk dagangan yang cekap.


