


Kumpulan kami mempunyai lebih daripada 7,000,000 pedagang!
Setiap hari kami bekerjasama untuk meningkatkan perdagangan. Kami mendapat keputusan yang tinggi dan bergerak ke hadapan.
Pengiktirafan oleh berjuta-juta pedagang di seluruh dunia adalah penghargaan terbaik untuk kerja kami! Anda membuat pilihan anda dan kami akan melakukan segalanya yang diperlukan untuk memenuhi jangkaan anda!
Kami adalah kumpulan yang terbaik bersama!
InstaSpot. Berbangga bekerja untuk anda!


Pelakon, juara kejohanan UFC 6 dan seorang wira sebenar!
Lelaki yang membuat dirinya sendiri. Lelaki yang mengikut cara kami.
Rahsia di sebalik kejayaan Taktarov adalah pergerakan berterusan ke arah matlamat.
Dedahkan semua segi bakat anda!
Cari, cuba, gagal - tetapi tidak pernah berhenti!
InstaSpot. Kisah kejayaan anda bermula di sini!

The wave pattern on the EUR/USD 4-hour chart has transformed, but overall remains quite clear. There is no indication that the upward trend segment, which began in January 2025, has been canceled, but the wave structure has become significantly more complex since July 1 and has taken on a more extended form. In my view, the instrument has completed the formation of corrective wave 4, which took a very unconventional shape. Within this wave, we see exclusively corrective structures, so there is no doubt about the corrective nature of the decline.
In my opinion, the upward trend segment is not yet complete, and its targets stretch as far as the 1.25 level. The a-b-c-d-e wave sequence looks complete; therefore, I expect a new bullish wave set to form in the coming weeks. We have seen the expected waves 1 and 2, and the instrument is now forming wave 3 or c. I expect the instrument to rise toward 1.1717 within this wave, which corresponds to the 38.2% Fibonacci retracement. However, formally, the third wave may be considered complete at any moment, as it has already exceeded the peak of wave 1.
The EUR/USD exchange rate once again barely changed on Wednesday. The day before, the euro fell slightly during the U.S. session, although it would be more accurate to say "the dollar strengthened slightly." Were there reasons for this, and how should we view dollar strength ahead of the FOMC meeting? Yesterday, two U.S. reports were released that, at first glance, deserved some attention: the ADP employment change report and the JOLTS job openings report. Let's break them down.
The ADP report has recently been released in a new format. Previously, it showed the monthly change in employment, but now it reports the average weekly change over the last four weeks. Frankly, I don't understand why the new format was introduced, how it is better than the old one, or why it is needed at all if the traditional monthly reports are still being published. But these are rhetorical questions — and the market responded brilliantly yesterday, showing exactly what it thinks of such innovations: it doesn't care.
The second report — JOLTS — covered September and October. On December 10. Hardly anyone took this report seriously from the start, since the data was already outdated. Moreover, the JOLTS report itself is only an indirect indicator of labor market conditions. What does it show? The number of job openings. There could be 10 million or even 20 million open positions — but if hiring is not happening, what is the point? Market participants and the Fed are interested in how many Americans are actually employed at the moment (and therefore paying taxes). Only the Nonfarm Payrolls report and the unemployment rate can answer that question. Therefore, demand for the U.S. dollar rose slightly yesterday, but overall the dollar strengthened slightly on Monday as well, and also last Friday.
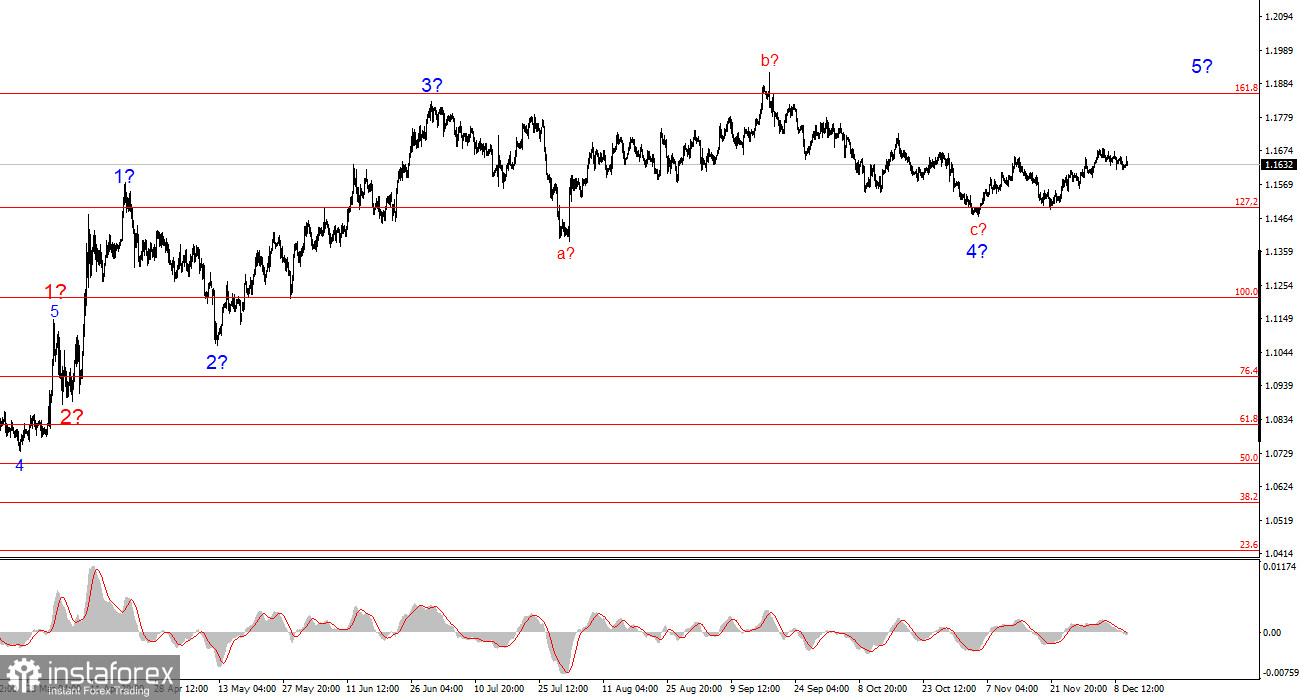
Based on the EUR/USD analysis, I conclude that the instrument continues to build an upward trend segment. Over the past few months the market has taken a pause, but the policies of Donald Trump and the Federal Reserve remain strong factors that may weaken the U.S. currency in the future. The targets of the current trend segment may extend up to the 1.25 level. However, the latest upward segment once again took on a corrective shape, which means at minimum a downward wave within this segment could begin now, and at maximum — a new downward corrective wave set.
On the lower time frame, the entire upward trend segment is visible. The wave pattern is not the most standard, since the corrective waves differ in size. For example, the higher-degree wave 2 is smaller than the internal wave 2 of wave 3. But this happens. I remind you that it is best to identify clear structures on the chart rather than trying to label every wave. Right now, the bullish structure is not in doubt.
The main principles of my analysis:
* Analisis pasaran yang disiarkan di sini adalah bertujuan untuk meningkatkan kesedaran anda, tetapi tidak untuk memberi arahan untuk membuat perdagangan.
Kajian analisis InstaSpot akan membuat anda mengetahui sepenuhnya aliran pasaran! Sebagai pelanggan InstaSpot, anda disediakan sejumlah besar perkhidmatan percuma untuk dagangan yang cekap.


