


Kumpulan kami mempunyai lebih daripada 7,000,000 pedagang!
Setiap hari kami bekerjasama untuk meningkatkan perdagangan. Kami mendapat keputusan yang tinggi dan bergerak ke hadapan.
Pengiktirafan oleh berjuta-juta pedagang di seluruh dunia adalah penghargaan terbaik untuk kerja kami! Anda membuat pilihan anda dan kami akan melakukan segalanya yang diperlukan untuk memenuhi jangkaan anda!
Kami adalah kumpulan yang terbaik bersama!
InstaSpot. Berbangga bekerja untuk anda!


Pelakon, juara kejohanan UFC 6 dan seorang wira sebenar!
Lelaki yang membuat dirinya sendiri. Lelaki yang mengikut cara kami.
Rahsia di sebalik kejayaan Taktarov adalah pergerakan berterusan ke arah matlamat.
Dedahkan semua segi bakat anda!
Cari, cuba, gagal - tetapi tidak pernah berhenti!
InstaSpot. Kisah kejayaan anda bermula di sini!

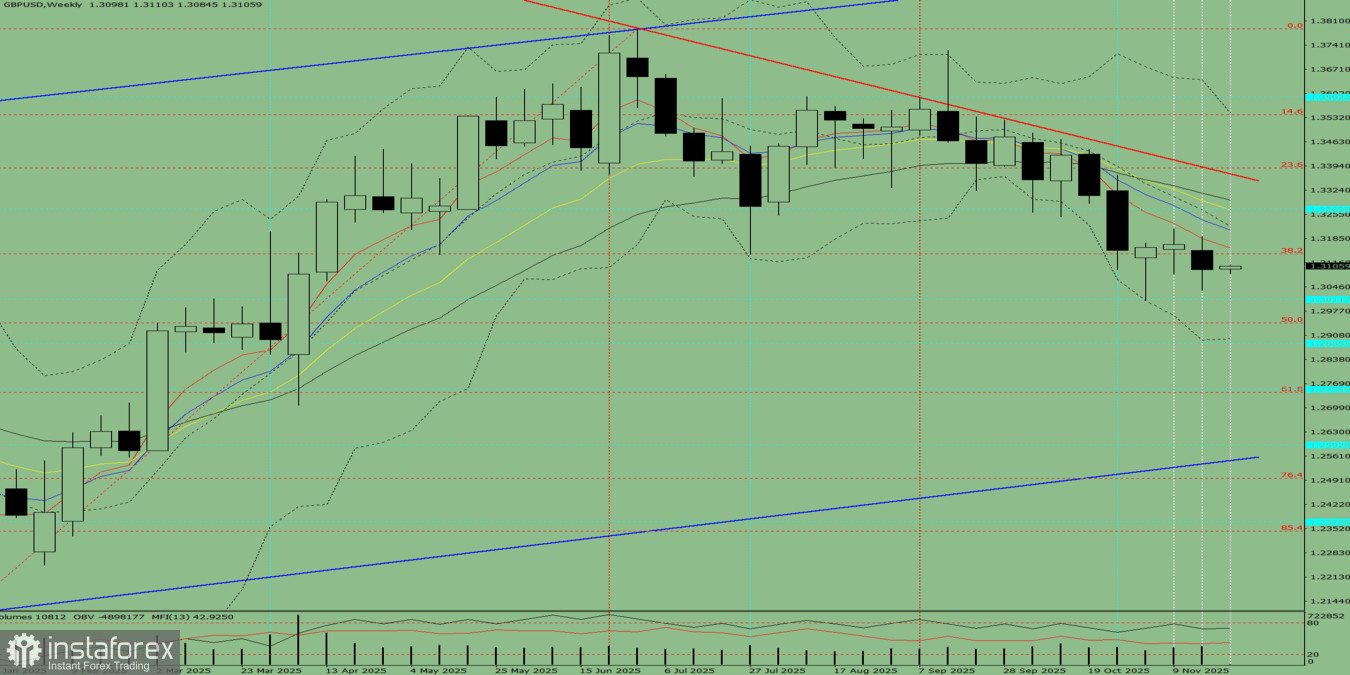
Trend Analysis.
This week, the price at the level of 1.3096 (the closing of the last weekly candle) may begin to move upwards with a target of 1.3270 – a historical resistance level (blue dashed line). When testing this level, the price may pull back down to a target of 1.3224 – the 8-period EMA (blue thin line).
Comprehensive Analysis:
Conclusion from Comprehensive Analysis: Upward trend.
Overall assessment of the GBP/USD weekly candle calculation: the price is most likely to have an upward trend this week, with the absence of a first lower shadow on the weekly white candle (Monday – upward) and the presence of a second upper shadow (Friday – downward).
Alternative Scenario: The price from the level of 1.3096 (the closing of the last weekly candle) may begin to move upward with a target of 1.3224 – the 8-period EMA (blue thin line). Upon reaching this line, a downward price movement to the target of 1.3142 – the 38.2% retracement level (red dashed line) is possible.
* Analisis pasaran yang disiarkan di sini adalah bertujuan untuk meningkatkan kesedaran anda, tetapi tidak untuk memberi arahan untuk membuat perdagangan.
Kajian analisis InstaSpot akan membuat anda mengetahui sepenuhnya aliran pasaran! Sebagai pelanggan InstaSpot, anda disediakan sejumlah besar perkhidmatan percuma untuk dagangan yang cekap.


