


Legenda dalam pasukan InstaSpot!
Legenda! Anda fikir ia adalah satu retorik yang besar? Tetapi bagaimana untuk kita memanggil seorang lelaki, yang telah menjadi pemain Asia pertama yang memenangi kejohanan catur dunia junior pada usia 18 tahun dan menjadi Grandmaster India pertama pada usia 19 tahun? Itulah permulaan yang sukar untuk merangkul gelaran Juara Dunia untuk Viswanathan Anand, seorang juara yang telah menjadi sebahagian daripada sejarah catur. Kini satu lagi legenda dalam pasukan InstaSpot!


Borussia adalah salah satu kelab bola sepak paling terkemuka di Jerman, yang telah berulang kali membuktikan kepada peminatnya: semangat persaingan dan kepemimpinan pasti akan membawa kepada kejayaan. Berdagang dengan cara yang sama seperti atlet sukan profesional beraksi menentang lawan: yakin dan aktif. Simpan "hantaran" dari Borussia FC dan menjadi pedagang hebat dengan InstaSpot!

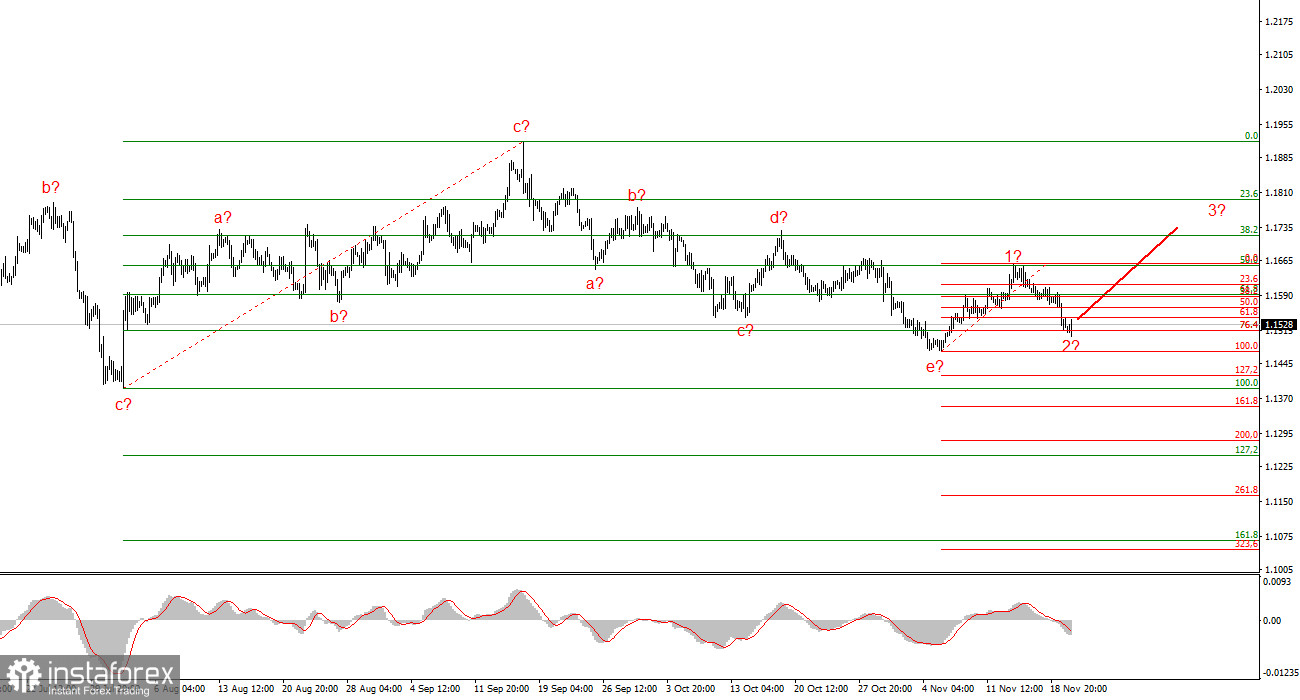
The wave pattern on the 4-hour chart for EUR/USD has transformed, but overall it remains quite clear. There is no talk of canceling the upward trend segment that began in January 2025, but the wave structure has become significantly more complex and extended since July 1. In my view, the instrument is in the process of forming corrective wave 4, which has taken on a non-standard shape. Within this wave we observe exclusively corrective structures, so there is no doubt about the corrective nature of the decline.
In my opinion, the formation of the upward trend segment is not yet complete, and its targets extend up to the 1.25 level. The series of waves a-b-c-d-e appears complete, and therefore I expect the formation of a new upward wave set in the coming weeks. We have seen the presumed wave 1 or a, and now the instrument is in the process of forming wave 2 or b. I expected the second wave to finish in the 38.2%–61.8% Fibonacci area of the first wave, but today the quotes dropped to 76.4%. Such a decline still allows for the formation of wave 3 or c.
The EUR/USD rate again remained almost unchanged during Thursday. As of the start of the U.S. session, the movement amplitude was about 20 basis points. A couple of hours ago, the U.S. released reports the market had been waiting for over a month. But as it turned out, not very eagerly—judging by the reaction. What kind of reaction is 40 points for two major reports?
Today's U.S. data was mixed. Payrolls for September came in at 119,000 versus the market expectation of 50,000. However, at the same time, the unemployment rate rose to 4.4%, which the market did not expect. So one report suggested the U.S. currency could continue strengthening, while the other strongly opposed it. As of now, market participants haven't decided which report is more important or what they mean together, so market movements remain minimal.
Unfortunately, the reports the market had been anticipating even more than the FOMC meeting are now outdated. Who cares about September data at the end of November? Today it also became known that the unemployment and labor market reports for October will not be released at all, so the next data will reflect the situation for November. The market will likely draw conclusions based on those numbers. The September payroll report significantly reduced the likelihood of a Fed rate cut in December, which is good for the dollar.
Based on the EUR/USD analysis, I conclude that the instrument is continuing to build an upward trend segment. Over the past few months, the market has taken a pause, but Donald Trump's policies and the Federal Reserve remain significant factors for the future decline of the U.S. currency. The targets of the current trend segment may extend up to the 1.25 level. At this time, the construction of an upward wave set may continue. I expect that from the current positions, the formation of the third wave of this set will begin, which may be either wave c or wave 3. In the coming days, I am considering long positions with targets around 1.1740, and an upward reversal of the MACD indicator will confirm this signal.
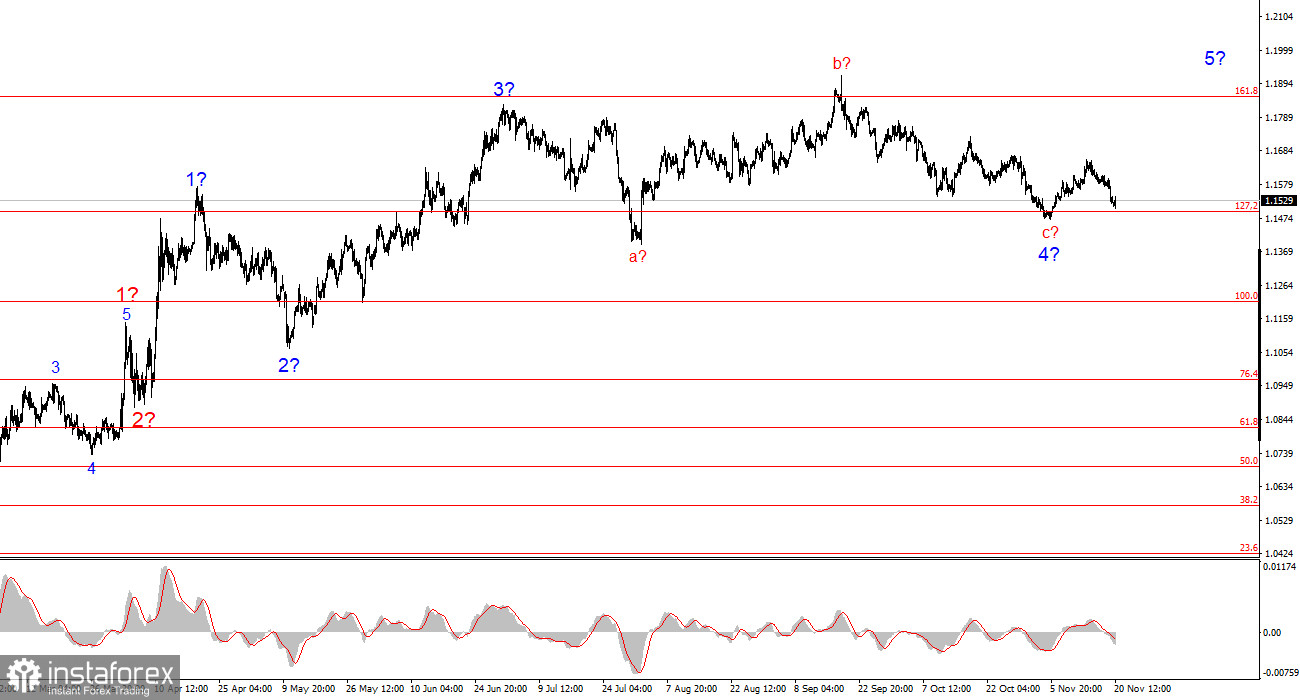
On a smaller scale, the entire upward trend segment is visible. The wave structure is not the most standard, as the corrective waves differ in size. For example, the larger wave 2 is smaller than the internal wave 2 in wave 3. However, such cases do occur. I remind you that it is best to identify clear structures on the chart rather than trying to label every single wave. Currently, the upward structure raises no doubts.
* Analisis pasaran yang disiarkan di sini adalah bertujuan untuk meningkatkan kesedaran anda, tetapi tidak untuk memberi arahan untuk membuat perdagangan.
Kajian analisis InstaSpot akan membuat anda mengetahui sepenuhnya aliran pasaran! Sebagai pelanggan InstaSpot, anda disediakan sejumlah besar perkhidmatan percuma untuk dagangan yang cekap.


