


Kumpulan kami mempunyai lebih daripada 7,000,000 pedagang!
Setiap hari kami bekerjasama untuk meningkatkan perdagangan. Kami mendapat keputusan yang tinggi dan bergerak ke hadapan.
Pengiktirafan oleh berjuta-juta pedagang di seluruh dunia adalah penghargaan terbaik untuk kerja kami! Anda membuat pilihan anda dan kami akan melakukan segalanya yang diperlukan untuk memenuhi jangkaan anda!
Kami adalah kumpulan yang terbaik bersama!
InstaSpot. Berbangga bekerja untuk anda!


Pelakon, juara kejohanan UFC 6 dan seorang wira sebenar!
Lelaki yang membuat dirinya sendiri. Lelaki yang mengikut cara kami.
Rahsia di sebalik kejayaan Taktarov adalah pergerakan berterusan ke arah matlamat.
Dedahkan semua segi bakat anda!
Cari, cuba, gagal - tetapi tidak pernah berhenti!
InstaSpot. Kisah kejayaan anda bermula di sini!

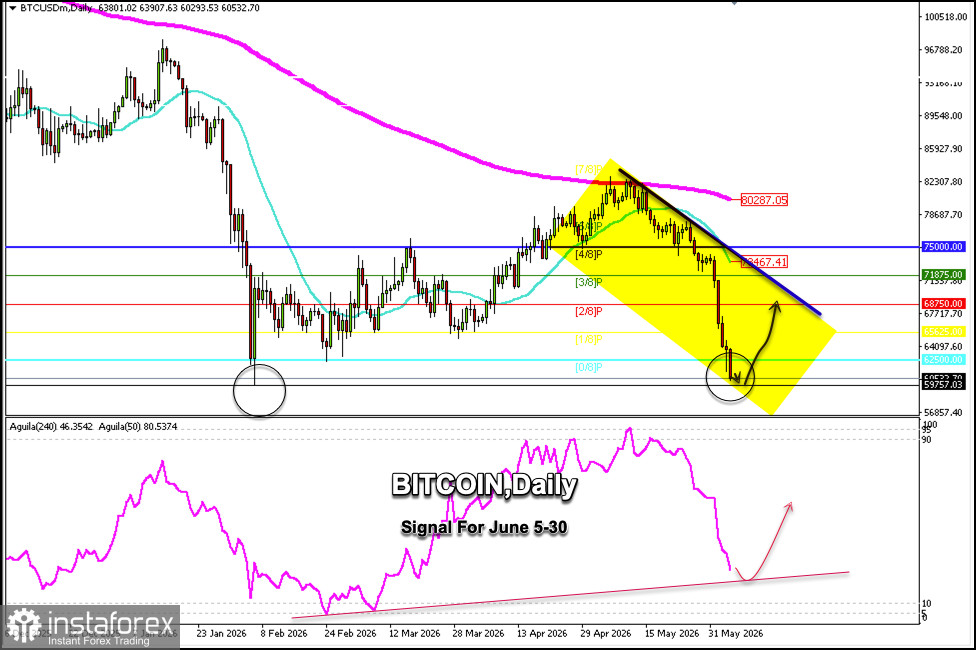
Bitcoin is trading around $60,532, reaching price levels last seen in February 2006 when it hit $59,735. Bitcoin could reach this low in the coming hours. If a technical bounce occurs, it could form a double bottom pattern, which would signify a sustained recovery in the short term.
The daily Bitcoin chart shows that it has reached oversold levels, and a recovery is technically expected in the coming hours.
Bearish pressure will continue over the next few days, so if a technical bounce occurs towards the strong Murray 2/8 support zone located around $68,750, the instrument could resume a bearish cycle.
Given that Bitcoin has reached the psychological level of $60,000, this level is key and decisive. Therefore, we would look for buying opportunities in the coming hours, always with a stop-loss order below the February low, with targets at the 0/8 Murray level around $62,500 and finally around $68,750.
If our strategy is bearish, we should wait for a technical bounce in the coming hours and then take short positions. A clear area to sell could be the $65,000 zone. This level also served as support in March and has now become strong resistance, so if Bitcoin reaches these levels, we could open short positions.
The daily chart shows that the Eagle indicator is showing a negative signal, so as long as the BTC/USD price remains below the 21 SMA and below the 200 SMA, any technical bounce in the medium term will be considered a signal to continue selling.
* Analisis pasaran yang disiarkan di sini adalah bertujuan untuk meningkatkan kesedaran anda, tetapi tidak untuk memberi arahan untuk membuat perdagangan.
Kajian analisis InstaSpot akan membuat anda mengetahui sepenuhnya aliran pasaran! Sebagai pelanggan InstaSpot, anda disediakan sejumlah besar perkhidmatan percuma untuk dagangan yang cekap.


