


Kumpulan kami mempunyai lebih daripada 7,000,000 pedagang!
Setiap hari kami bekerjasama untuk meningkatkan perdagangan. Kami mendapat keputusan yang tinggi dan bergerak ke hadapan.
Pengiktirafan oleh berjuta-juta pedagang di seluruh dunia adalah penghargaan terbaik untuk kerja kami! Anda membuat pilihan anda dan kami akan melakukan segalanya yang diperlukan untuk memenuhi jangkaan anda!
Kami adalah kumpulan yang terbaik bersama!
InstaSpot. Berbangga bekerja untuk anda!


Pelakon, juara kejohanan UFC 6 dan seorang wira sebenar!
Lelaki yang membuat dirinya sendiri. Lelaki yang mengikut cara kami.
Rahsia di sebalik kejayaan Taktarov adalah pergerakan berterusan ke arah matlamat.
Dedahkan semua segi bakat anda!
Cari, cuba, gagal - tetapi tidak pernah berhenti!
InstaSpot. Kisah kejayaan anda bermula di sini!

The wave structure on the 4-hour chart for #SPX appears uncertain but generally clear. The 24-hour chart reveals a global five-wave structure, so expansive that it does not fully fit within the terminal window even at the minimum scale. In simple terms, U.S. stock indices have been in an uptrend for a very long time. However, we know that trends eventually reverse. Currently, the formation of wave 5 in wave 5 is ongoing. The index has made four unsuccessful attempts to break above 6093, which corresponds to 200.0% Fibonacci retracement from wave 4. In my view, a new corrective wave or a series of corrections is likely in the near future. The U.S. stock market is overheated, and more analysts are beginning to talk about a "bubble."
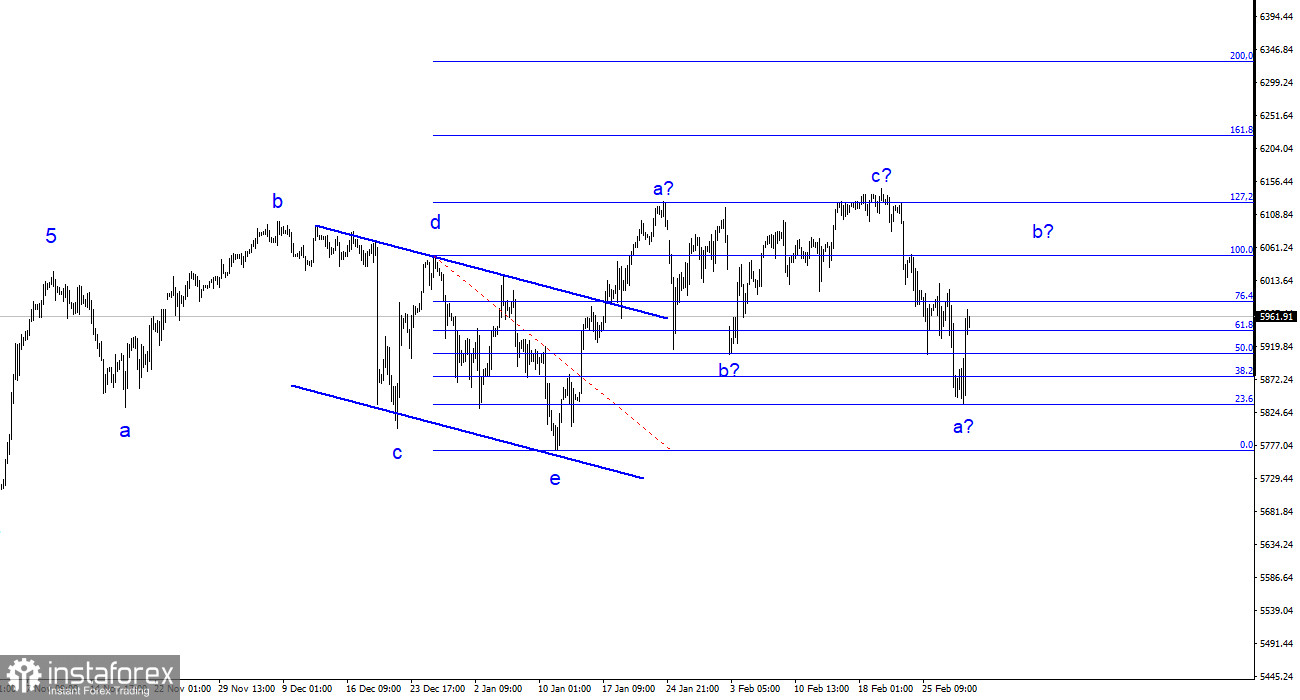
Switching to the 4-hour chart, we can observe a completed complex corrective structure (a-b-c-d-e) followed by a new upward wave structure in an a-b-c formation. This suggests that a new bearish structure is now forming, with wave b currently unfolding, after which further decline should resume. Another upward impulse could occur, but it would likely be followed by a more significant drop in the index. At this stage, I would rely more on the daily chart analysis.
The #SPX continues trading near historical peaks, and investors remain reluctant to exit their positions in major U.S. stocks. As I previously mentioned, the stock market entered a new bullish phase nearly two years ago, when U.S. inflation began slowing, and expectations of Federal Reserve monetary policy easing emerged. Now, this process is fully underway, and I would not expect further significant gains in U.S. stock indices as the market has already priced in these factors.
The fundamental backdrop for U.S. stock indices continues to deteriorate. The latest GDP report came in weaker than expected, indicating that the economy is slowing down. The Federal Reserve has essentially halted its monetary policy easing, whereas the stock market favors looser financial conditions and dislikes tightening. Stocks thrive in a dovish monetary environment or at least when easing is expected, which has been the case for the past two years.
Now, however, inflation in the U.S. is rising again, and Trump's policies are likely to accelerate it even further. The U.S. president's approach to international affairs is causing more investor concern than optimism. I still believe we are in for a prolonged and complex correction, making it unlikely that we will see further growth in stock indices.
Over the weekend, a scandal erupted at the White House involving Donald Trump and Volodymyr Zelensky. The fallout led to Ukraine backing out of a natural resources deal and the U.S. withdrawing further financial support for Ukraine. Over the past six weeks, almost every geopolitical development of this nature has fueled demand for U.S. stocks. However, I still expect SP500 and other indices to decline.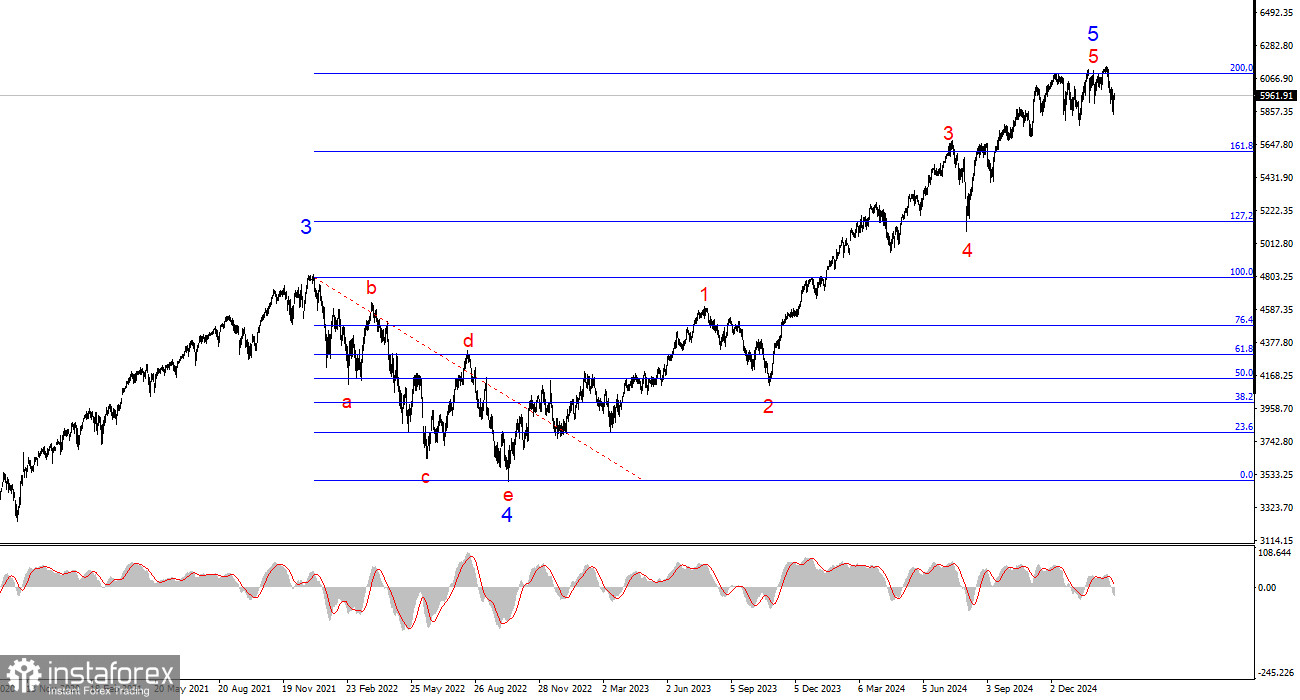
Based on my #SPX analysis, I conclude that the index is nearing the end of its uptrend. Given the current situation, I suggest monitoring the 6125 level and Trump's economic policies. Trump is making decisions that threaten the stability of the U.S. economy and major American corporations, including trade wars, tariffs, and import restrictions. The likelihood of a new downtrend is increasing daily. The "bubble" in the U.S. stock market is at its peak. The 4-hour chart suggests another potential upward move before a drop, while the 24-hour chart points to the conclusion of the uptrend.
On the higher wave scale, the structure is much clearer—a five-wave bullish cycle with a five-wave pattern within the final wave. This fifth wave appears to be approaching its end. As a result, I would prepare for a prolonged and complex correction, which may have already begun.
* Analisis pasaran yang disiarkan di sini adalah bertujuan untuk meningkatkan kesedaran anda, tetapi tidak untuk memberi arahan untuk membuat perdagangan.
Kajian analisis InstaSpot akan membuat anda mengetahui sepenuhnya aliran pasaran! Sebagai pelanggan InstaSpot, anda disediakan sejumlah besar perkhidmatan percuma untuk dagangan yang cekap.


