


Kumpulan kami mempunyai lebih daripada 7,000,000 pedagang!
Setiap hari kami bekerjasama untuk meningkatkan perdagangan. Kami mendapat keputusan yang tinggi dan bergerak ke hadapan.
Pengiktirafan oleh berjuta-juta pedagang di seluruh dunia adalah penghargaan terbaik untuk kerja kami! Anda membuat pilihan anda dan kami akan melakukan segalanya yang diperlukan untuk memenuhi jangkaan anda!
Kami adalah kumpulan yang terbaik bersama!
InstaSpot. Berbangga bekerja untuk anda!


Pelakon, juara kejohanan UFC 6 dan seorang wira sebenar!
Lelaki yang membuat dirinya sendiri. Lelaki yang mengikut cara kami.
Rahsia di sebalik kejayaan Taktarov adalah pergerakan berterusan ke arah matlamat.
Dedahkan semua segi bakat anda!
Cari, cuba, gagal - tetapi tidak pernah berhenti!
InstaSpot. Kisah kejayaan anda bermula di sini!

EUR/USD
Higher timeframes
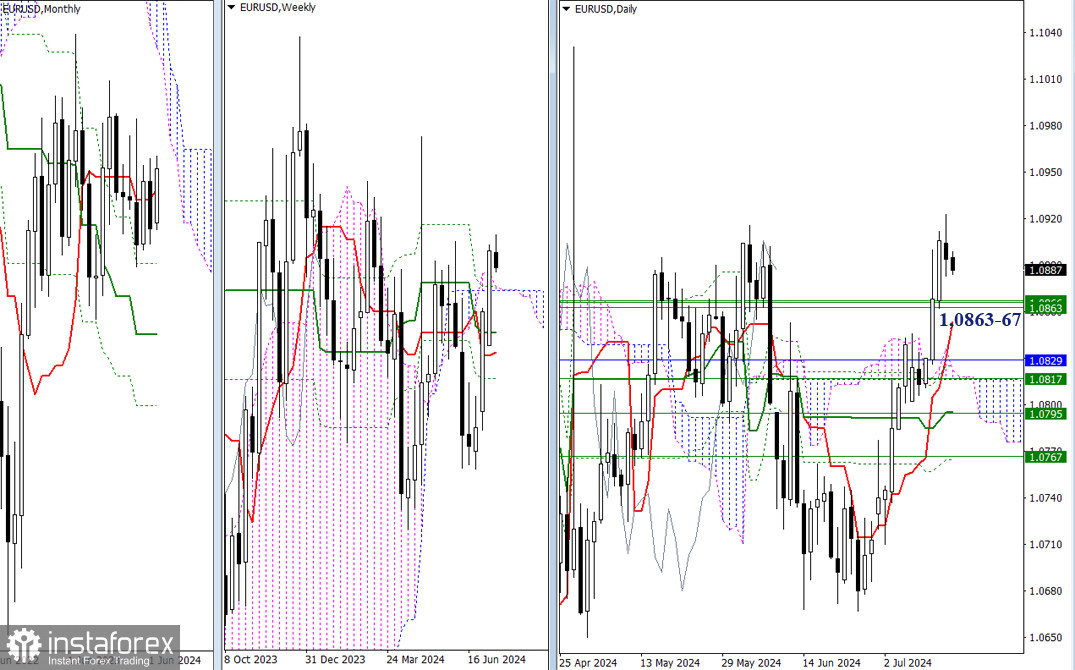
The bulls took a break, having tested the June high (1.0916). They prefer to be patient to avoid the prospects of a full-fledged correction. In this case, consolidation above 1.0916 will allow us to consider a rise to the April high (1.1031). A corrective decline in this part of the chart will bring EUR/USD back to the area of strong weekly levels (1.0863 - 1.0867) and the daily short-term trend (1.0854). The influence of so many strong levels may restrain the bullish development, moreover, if the bears manage to consolidate below 1.0863-67-54, this could strengthen the bearish bias in the market.
H4 – H1
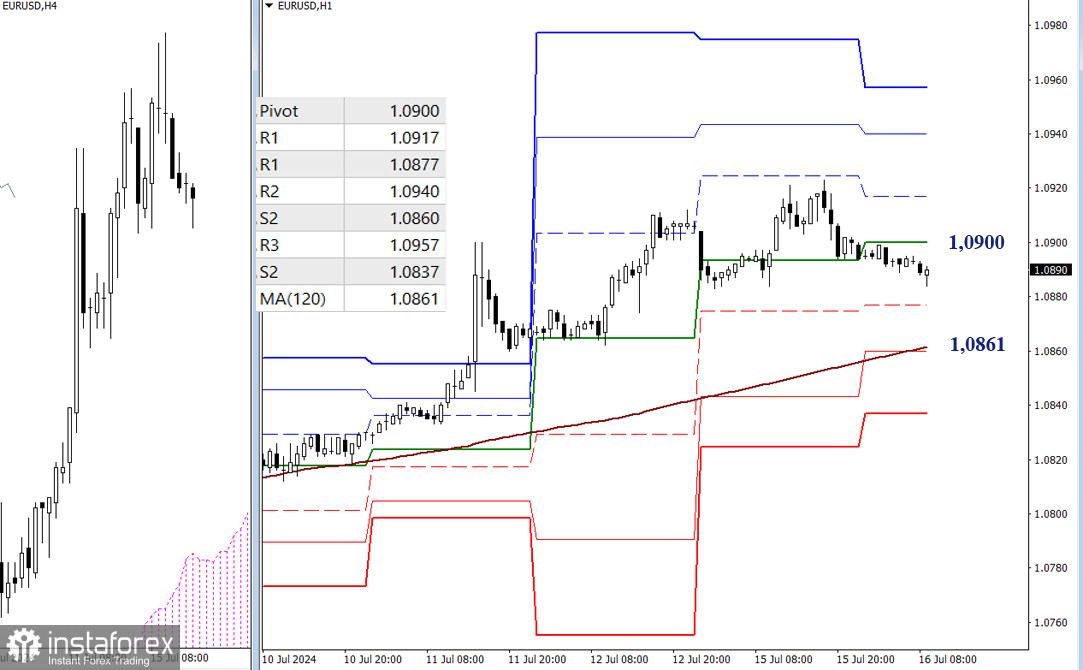
The bulls currently have the main advantage on the lower timeframes, but at the same time we're seeing the progress of a corrective decline. Losing the support of the central Pivot level (1.0900), approaching the intermediate support of S1 (1.0877), and after that the main level - will the weekly long-term trend (1.0861) come into play. The trend is responsible for the current balance of forces. Its breakdown and reversal will give the main advantage to the bears. In case the correction ends in the nearest future, traders will turn to the bullish benchmarks of the lower timeframes - resistances of the classic Pivot levels, which are currently located at 1.0917 - 1.0940 - 1.0957.
***
GBP/USD
Higher timeframes
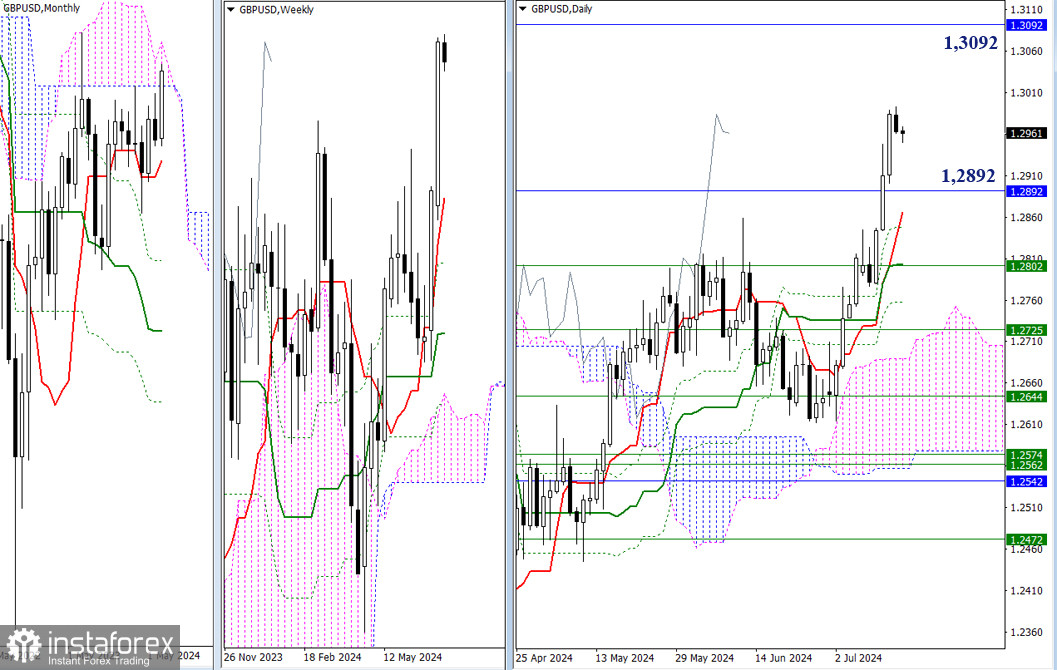
The bullish bias indicated a slowdown yesterday, but in general, the situation did not go through any significant changes. GBP/USD is still trading between the boundaries of the monthly cloud (1.3092 - 1.2892), which means that the main conclusions and expectations announced earlier have not changed. New prospects on this section of the chart may only appear after the pair goes beyond the boundaries of the monthly Ichimoku cloud (1.3092 - 1.2892).
H4 – H1
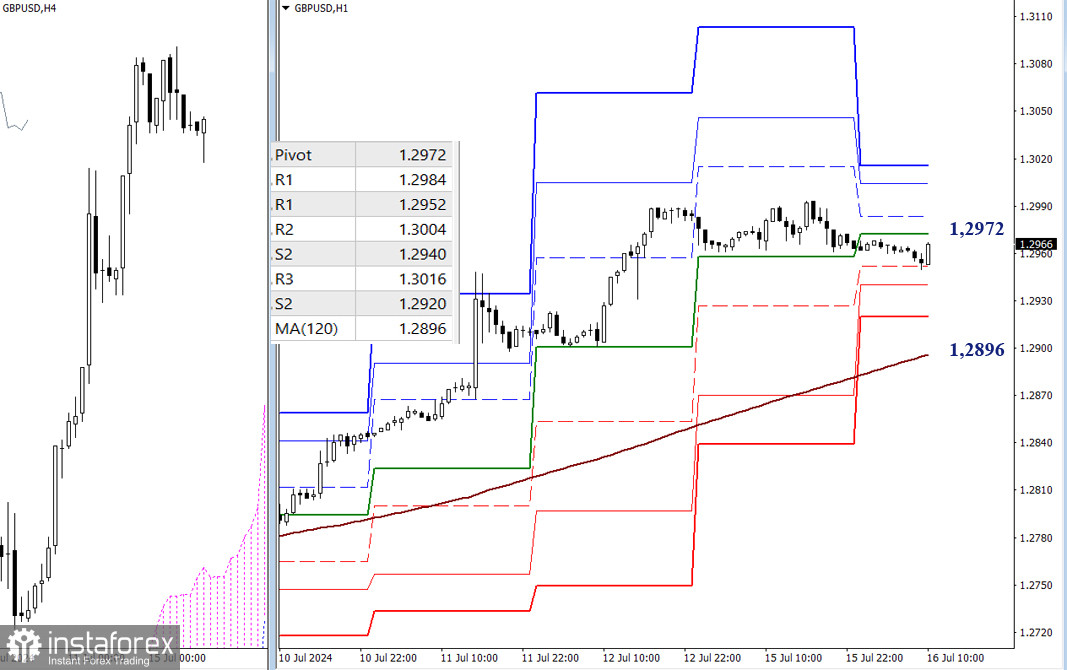
At the moment, the pair is in the correction zone on the lower timeframes, but the bulls still have the main advantage. The classic Pivot levels are gathered in a narrow range today, as the previous day's movement was not distinguished by the scale. Resistance (1.2972 - 1.2984 - 1.3004 - 1.3016) may be useful for the bulls. On the other hand, supports of classic Pivot levels (1.2952 - 1.2940 - 1.2920) may be of value for the bears. The main benchmark of the lower timeframes - weekly long-term trend (1.2896), is currently located at a considerable distance from the price chart, so it may not come into play today.
***
The technical analysis of the situation uses:
Higher timeframes - Ichimoku Kinko Hyo (9.26.52) + Fibonacci Kijun levels
Lower timeframes - H1 - Pivot Points (classic) + Moving Average 120 (weekly long-term trend)
* Analisis pasaran yang disiarkan di sini adalah bertujuan untuk meningkatkan kesedaran anda, tetapi tidak untuk memberi arahan untuk membuat perdagangan.
Kajian analisis InstaSpot akan membuat anda mengetahui sepenuhnya aliran pasaran! Sebagai pelanggan InstaSpot, anda disediakan sejumlah besar perkhidmatan percuma untuk dagangan yang cekap.


