


Legenda dalam pasukan InstaSpot!
Legenda! Anda fikir ia adalah satu retorik yang besar? Tetapi bagaimana untuk kita memanggil seorang lelaki, yang telah menjadi pemain Asia pertama yang memenangi kejohanan catur dunia junior pada usia 18 tahun dan menjadi Grandmaster India pertama pada usia 19 tahun? Itulah permulaan yang sukar untuk merangkul gelaran Juara Dunia untuk Viswanathan Anand, seorang juara yang telah menjadi sebahagian daripada sejarah catur. Kini satu lagi legenda dalam pasukan InstaSpot!


Borussia adalah salah satu kelab bola sepak paling terkemuka di Jerman, yang telah berulang kali membuktikan kepada peminatnya: semangat persaingan dan kepemimpinan pasti akan membawa kepada kejayaan. Berdagang dengan cara yang sama seperti atlet sukan profesional beraksi menentang lawan: yakin dan aktif. Simpan "hantaran" dari Borussia FC dan menjadi pedagang hebat dengan InstaSpot!

The dollar plummeted on Wednesday, with its DXY index dropping by about 50 pips. It extended losses in early trade today, accompanied by a decline in US Treasury yields.
Markets are anticipating a rate cut from the Fed, despite Jerome Powell's virtually neutral rhetoric and warnings from other Fed officials about excessive expectations regarding monetary policy easing by the US central bank.
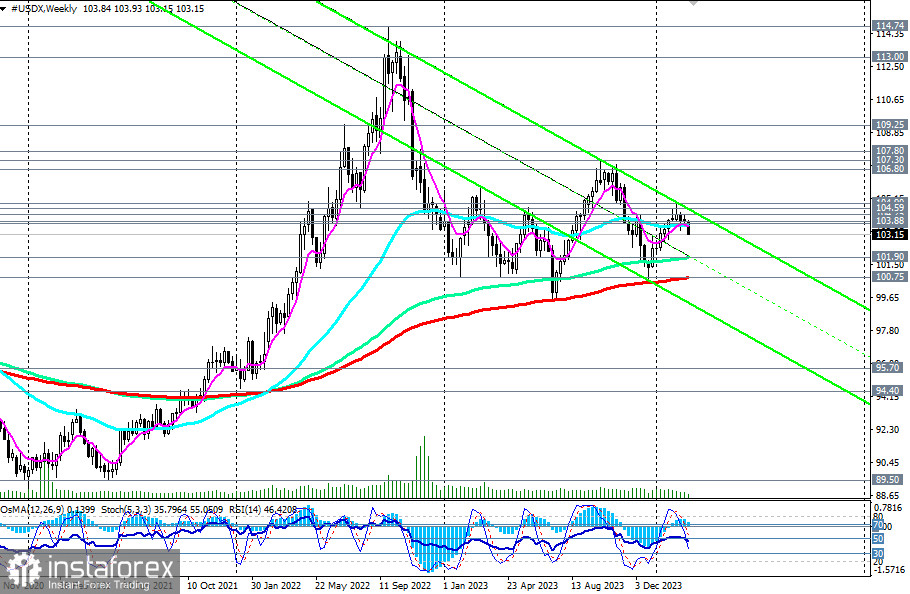
From a technical point of view, the US dollar index (CFD #USDX on the MT4 platform) is deepening within a downward channel on the weekly chart, heading towards the key support level of 100.75 (200-period moving average on the weekly chart), which separates the long-term bull market from the bear one.
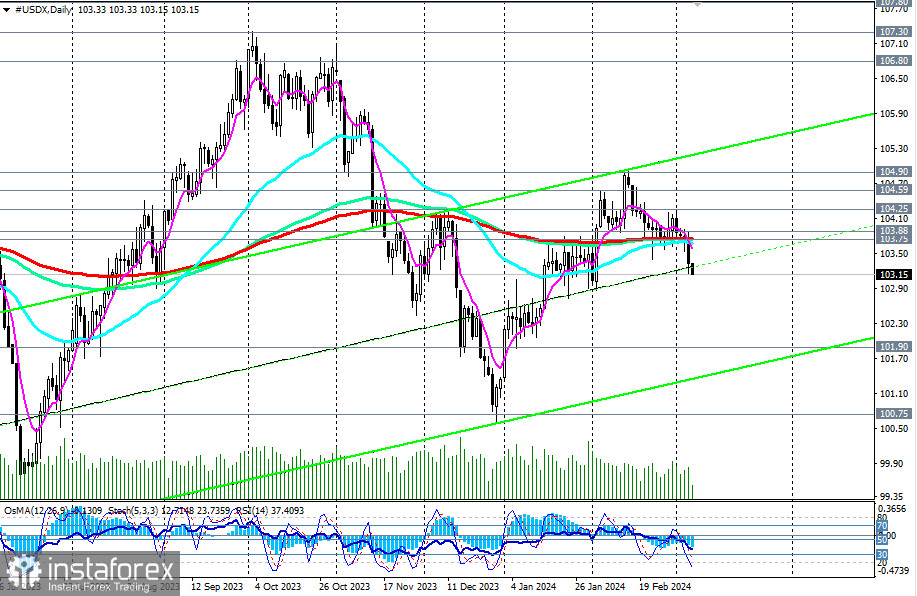
In the medium term, with the breach of the key support level of 103.75 (EMA200 on the daily chart), and in the short term, the US dollar index has already moved into the bear market zone. If the price breaks through the 103.00 mark, the index could decline to the support levels of 101.90, 100.75, and 100.00. Further developments will depend on the situation. In the meantime, the best way to make a profit is to open short positions.
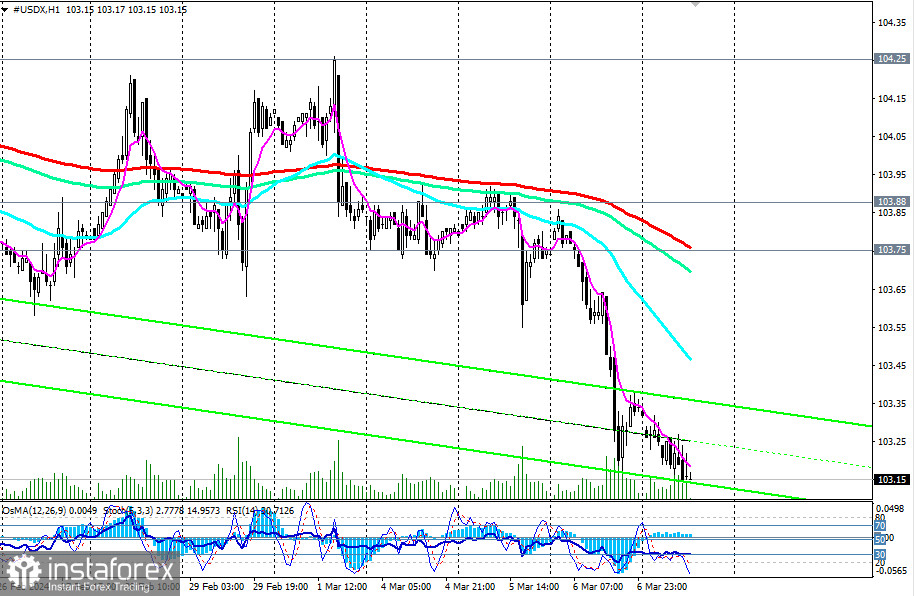
In an alternative scenario, a decline to the 103.00 mark will bring dollar buyers back into the market. In case of a breakout of the resistance levels of 103.75 (EMA200 on 1-hour, 4-hour, daily charts) and 103.88, a buy signal will be generated. A breakout of the local resistance levels at 104.90 and 105.00 could revive the dollar's long-term bullish trend. In this case, the index is expected to head towards the October highs and the marks of 106.50, 106.80, 107.00, and 107.30.
This scenario will be relevant if tomorrow's US Department of Labor report turns out stronger than expected, and fresh data to be released on Tuesday indicate rising inflation.
The further dynamics of the dollar and its DXY index will largely depend on fundamental factors and the Fed's policy steps.
*) see InstaSpot trading indicators for USDX
Support levels: 103.00, 102.00, 101.90, 101.00, 100.75, 100.00
Resistance levels: 103.75, 103.88, 104.00, 104.25, 104.59, 104.90, 105.00, 106.00, 106.80, 107.00, 107.30
Trading scenarios
Alternative scenario: Buy Stop 103.40. Stop-Loss 103.00. Targets 103.75, 103.88, 104.00, 104.25, 104.59, 104.90, 105.00, 106.00, 106.80, 107.00, 107.30
Main scenario: Sell Stop 103.10. Stop-Loss 103.40. Targets 103.00, 102.00, 101.90, 101.00, 100.75, 100.00
*) "Targets" correspond to support/resistance levels. This does not necessarily mean they will be reached, but they can serve as a guide in planning and placing your trading positions.
* Analisis pasaran yang disiarkan di sini adalah bertujuan untuk meningkatkan kesedaran anda, tetapi tidak untuk memberi arahan untuk membuat perdagangan.
Kajian analisis InstaSpot akan membuat anda mengetahui sepenuhnya aliran pasaran! Sebagai pelanggan InstaSpot, anda disediakan sejumlah besar perkhidmatan percuma untuk dagangan yang cekap.


