


GBP/USD
Analysis:
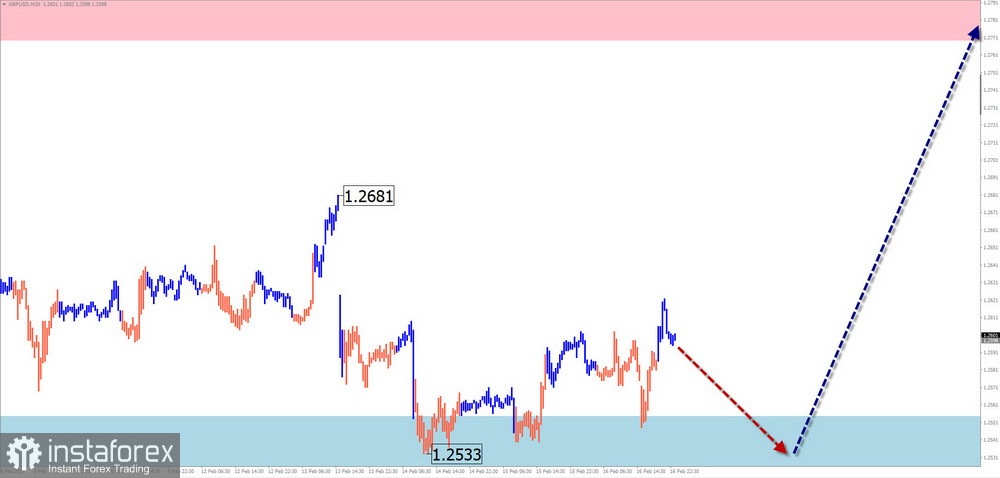
The short-term direction of price fluctuations for the British pound has been set by a descending wave algorithm since July 14 of the previous year. Since the beginning of October, the price has been forming the middle part (B) in a horizontal plane. The wave structure needs to be completed. At the time of the analysis, quotes are at the upper boundary of a powerful potential reversal zone on the weekly chart.
Forecast:
At the beginning of the upcoming week, one can expect renewed pressure on the support zone and the British pound transitioning into a sideways drift. Subsequently, a reversal formation and a resumption of price growth are anticipated. The resistance zone will limit the weekly range of the pair.
Potential reversal zones
Resistance:
Support:
Recommendations:
Selling: it has a low potential and is high risk.
Buying: will become relevant after confirmed reversal signals appear in the support zone.
AUD/USD
Analysis:
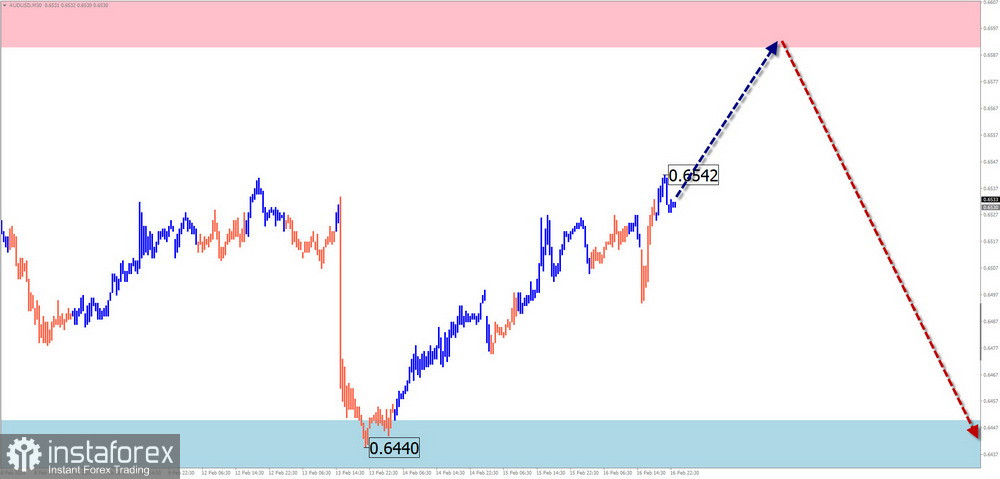
On the chart of the Australian dollar pair, a descending wave structure has been developing since the end of December of the previous year. Over the last month and a half, quotes have formed a correctional elongated flat. The final part (C) is forming within this movement but still needs to be completed.
Forecast:
In the next couple of days, the overall flat sentiment with a descending vector is expected to continue. Pressure on the support zone is possible with a brief breach of its lower boundary. Closer to the weekend, the probability of a price increase rises.
Potential reversal zones
Resistance:
Support:
Recommendations:
Selling: due to limited downside potential, it is risky and may lead to losses.
Buying: this can be used with reduced volume within individual trading sessions after corresponding signals from your TS appear.
USD/CHF
Analysis:
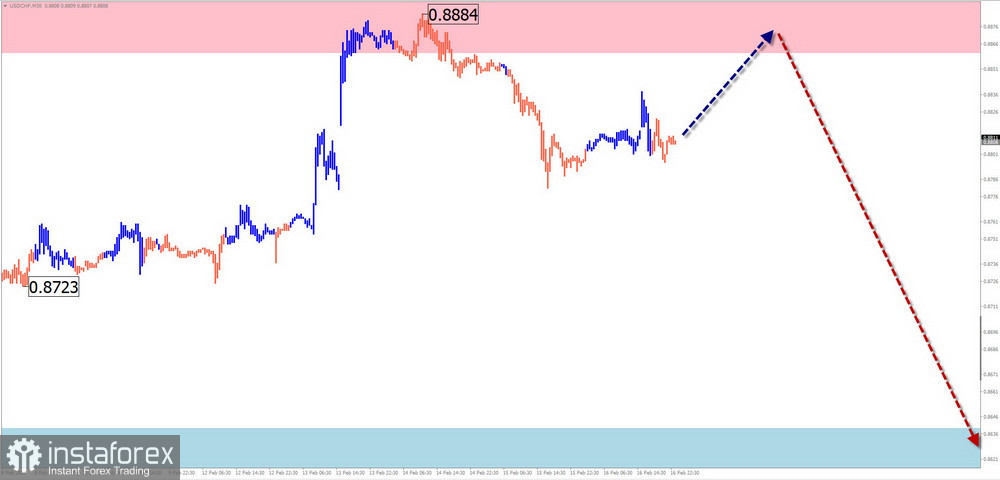
The direction of the price movement of the Swiss franc pair has been set by an ascending wave since the end of December of the previous year. The structure of this wave model looks complete at the moment. The bearish wave level from February 13 has reversal potential. Upon confirmation, it may mark the beginning of a full-fledged correction.
Forecast:
In the upcoming weekly period, the continuation of the overall sideways movement is expected. In the next few days, an ascending vector is more likely, with renewed pressure on the resistance zone. A reversal and the beginning of a price decline can be expected by the end of the week.
Potential reversal zones
Resistance:
Support:
Recommendations:
Buying: possible with reduced volume within individual sessions until the first reversal signals appear.
Selling: conditions for such transactions will be present once confirmed reversal signals appear in the resistance zone.
EUR/JPY
Analysis:
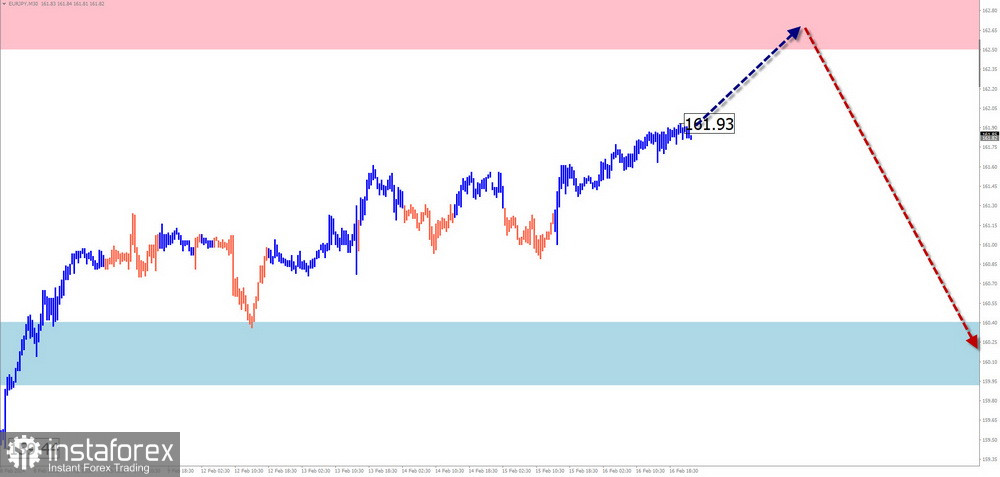
The unfinished wave model on the chart of the euro against the Japanese Yen reports from September 12 of the previous year. This is an ascending wave. The wave structure needs to look complete at the time of the analysis. Quotes are approaching the lower boundary of the potential reversal zone on the weekly TF.
Forecast:
Over the next few days, the overall upward trend is expected to continue. After contact, pressure on the resistance zone is likely, leading to a sideways drift. A brief breach of the upper boundary of the zone is possible. Closer to the weekend, the probability of a change in direction and a decrease towards the support zone increases.
Potential reversal zones
Resistance:
Support:
Recommendations:
Buying: possible with a fractional lot within intraday trading.
Selling: possibilities may arise after confirmed reversal signals appear in the resistance zone.
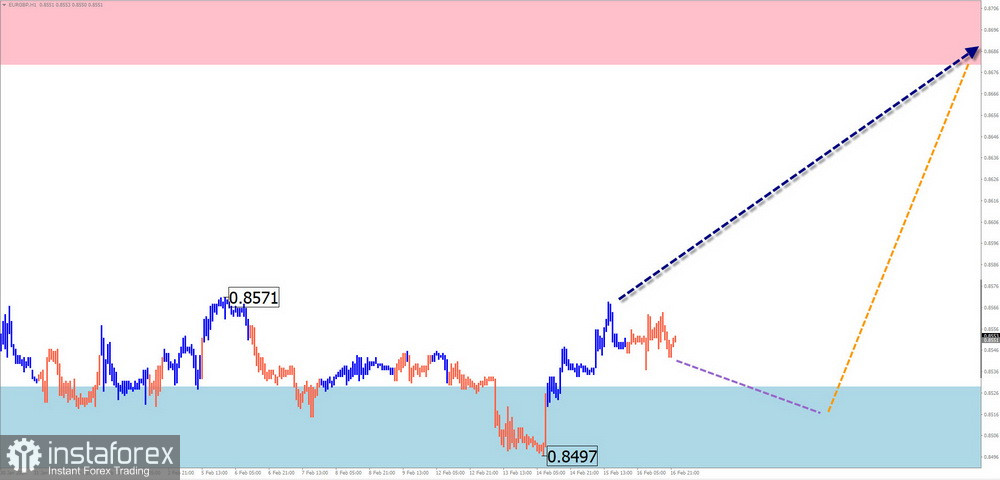
EUR/GBP
Brief analysis:
The direction of price movements for the euro/pound pair is determined by the algorithm of an unfinished descending wave since February 3 of the previous year. The wave is forming in a horizontal plane. In its structure, the middle part (B) is approaching completion. The price is at the lower edge of the formed price channel.
Weekly forecast:
In the first half of the upcoming week, the bearish sentiment will likely continue, with an attempt to pressure the support zone. Further, a reversal of direction and an increase in quotes are highly probable, aiming to reach the calculated resistance.
Potential reversal zones
Resistance:
Support:
Recommendations:
Buying: conditions for such transactions will only arise after confirmed reversal signals appear in the support zone.
Selling: has low potential and may become unprofitable.
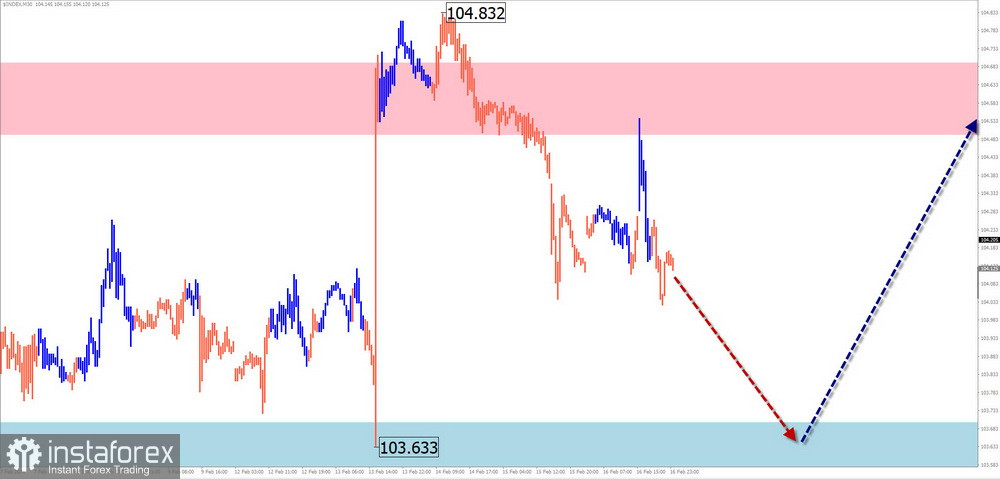
US dollar index
Brief analysis:
The algorithm of an ascending wave determines the direction of the short-term trend of the North American currency index since the end of the previous year. Quotes broke through the upper boundary of a powerful resistance, turning it into support. Along this zone, the dollar index has been forming a correctional elongated flat since February 5, which was not completed at the time of the analysis.
Weekly forecast:
In the coming days, the current corrective decline is expected to be completed. Further, a reversal formation can be anticipated in the support zone. The resumption of the index's growth can be expected at the end of the current or the beginning of the next week.
Potential reversal zones
Resistance:
Support:
Recommendations:
The period of weakening the US dollar position will be short-lived. It is necessary to focus on finding signals for selling national currencies in major pairs.
Explanation: In simplified wave analysis (SWA), all waves consist of 3 parts (A-B-C). Only the last unfinished wave is analyzed at each TF. Dashed lines show expected movements.
Attention: The wave algorithm does not consider the duration of instrument movements over time!
* Analisis pasaran yang disiarkan di sini adalah bertujuan untuk meningkatkan kesedaran anda, tetapi tidak untuk memberi arahan untuk membuat perdagangan.
Kajian analisis InstaSpot akan membuat anda mengetahui sepenuhnya aliran pasaran! Sebagai pelanggan InstaSpot, anda disediakan sejumlah besar perkhidmatan percuma untuk dagangan yang cekap.


