


Kumpulan kami mempunyai lebih daripada 7,000,000 pedagang!
Setiap hari kami bekerjasama untuk meningkatkan perdagangan. Kami mendapat keputusan yang tinggi dan bergerak ke hadapan.
Pengiktirafan oleh berjuta-juta pedagang di seluruh dunia adalah penghargaan terbaik untuk kerja kami! Anda membuat pilihan anda dan kami akan melakukan segalanya yang diperlukan untuk memenuhi jangkaan anda!
Kami adalah kumpulan yang terbaik bersama!
InstaSpot. Berbangga bekerja untuk anda!


Pelakon, juara kejohanan UFC 6 dan seorang wira sebenar!
Lelaki yang membuat dirinya sendiri. Lelaki yang mengikut cara kami.
Rahsia di sebalik kejayaan Taktarov adalah pergerakan berterusan ke arah matlamat.
Dedahkan semua segi bakat anda!
Cari, cuba, gagal - tetapi tidak pernah berhenti!
InstaSpot. Kisah kejayaan anda bermula di sini!

The Bank of England, during its planned meeting on Thursday, concluded a series of 14 consecutive interest rate hikes that began in December 2021 in an attempt to curb inflation. The base rate was raised to 5.25% in August, marking the highest level in the last 15 years. In a press release, the Bank of England stated that signs of the impact of tightening monetary policy on the labor market and the overall economy are beginning to emerge. It also pledged to monitor inflationary pressures and economic stability.
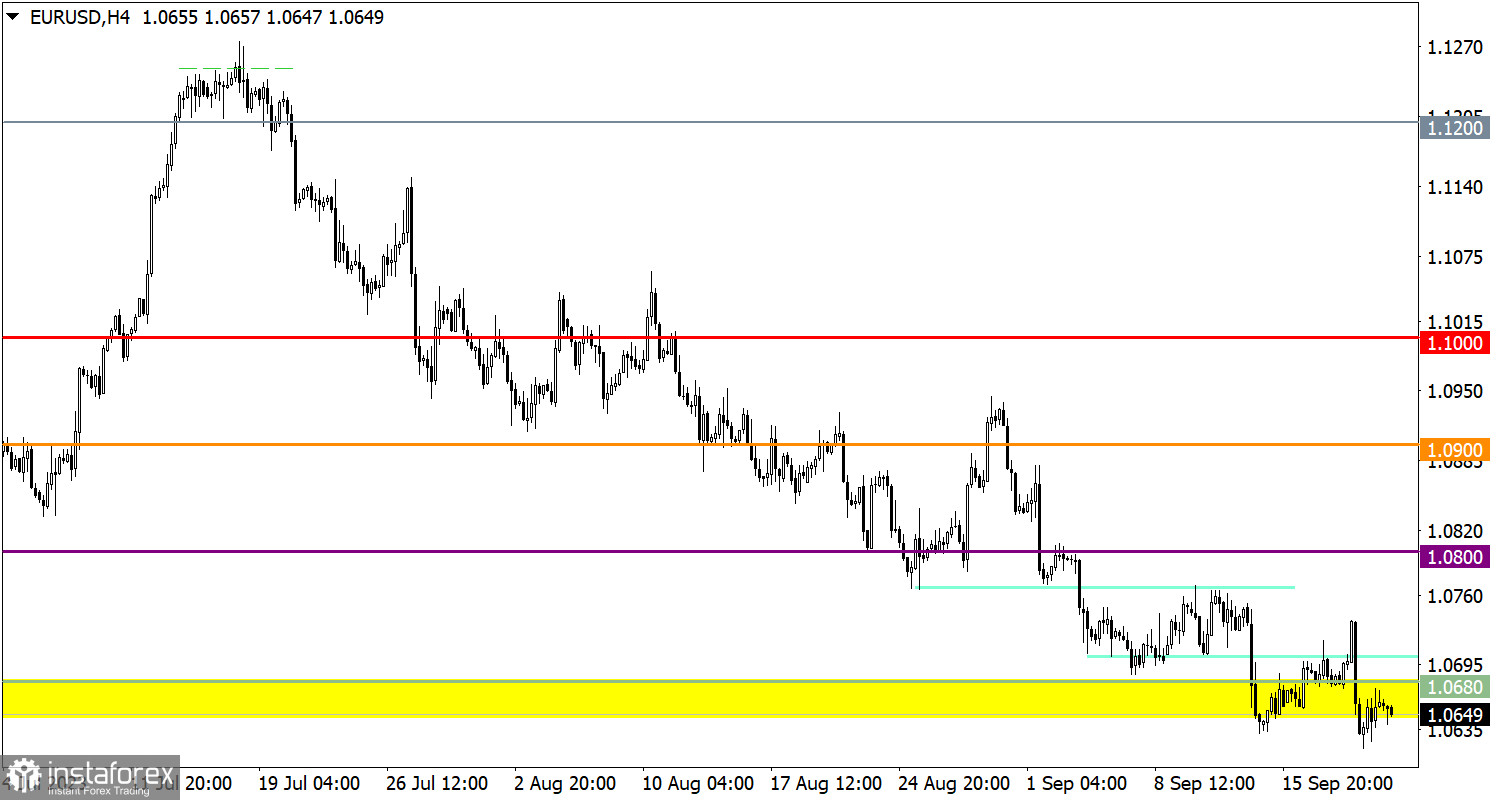
During the pullback, the EUR/USD currency pair returned to the previously established area of trading force interaction at 1.0650/1.0680. This price change does not disrupt the integrity of the downward cycle.
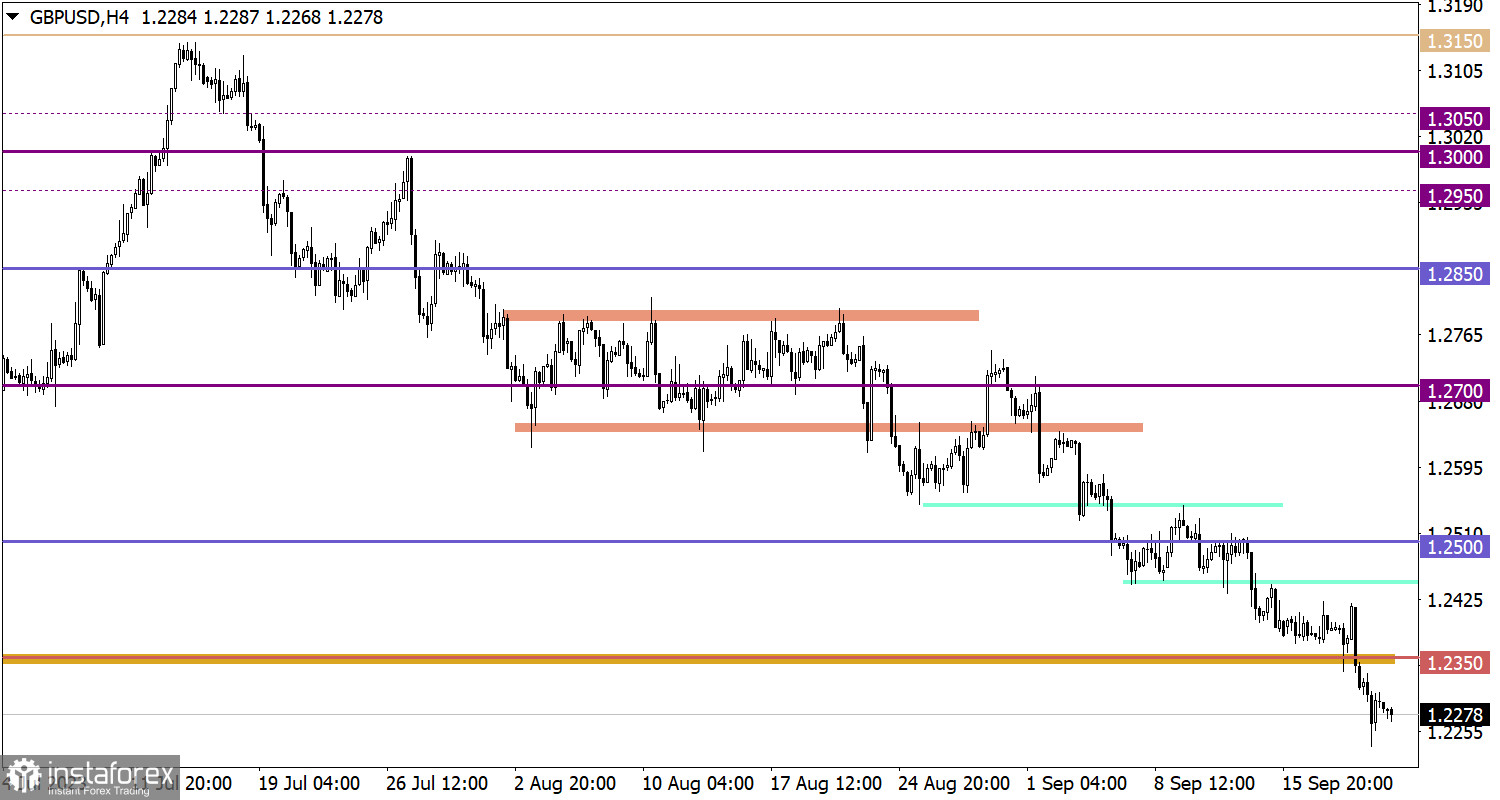
The GBP/USD pair, following the Bank of England meeting, locally declined below the value of 1.2250. However, there was almost immediately a rebound due to the high level of oversold British currency.
Today's macroeconomic calendar is packed with statistical data, including the publication of business activity indices in the European Union, the United Kingdom, and the United States. Considering that these data are preliminary estimates, they may trigger speculative movements in financial markets.
For a subsequent increase in short positions in the euro, it is necessary to consistently maintain the price below the value of 1.0600. In this case, the path towards the subsequent control level of 1.0500 may open. However, the technical signal of euro oversold status persists in the market despite the ongoing pullback. Therefore, there is a possibility of further pullback if the price stays above 1.0680.
The oversold status still holds, which is why the possibility of the price returning to the level of 1.2350 during a pullback cannot be ruled out. However, if speculators ignore the oversold status and the quote manages to establish itself below the value of 1.2250, there may be a subsequent increase in short positions.
The candlestick chart type is white and black graphic rectangles with lines above and below. With a detailed analysis of each individual candle, you can see its characteristics relative to a particular time frame: opening price, closing price, intraday high and low.
Horizontal levels are price coordinates, relative to which a price may stop or reverse its trajectory. In the market, these levels are called support and resistance.
Circles and rectangles are highlighted examples where the price reversed in history. This color highlighting indicates horizontal lines that may put pressure on the asset's price in the future.
The up/down arrows are landmarks of the possible price direction in the future.
* Analisis pasaran yang disiarkan di sini adalah bertujuan untuk meningkatkan kesedaran anda, tetapi tidak untuk memberi arahan untuk membuat perdagangan.
Kajian analisis InstaSpot akan membuat anda mengetahui sepenuhnya aliran pasaran! Sebagai pelanggan InstaSpot, anda disediakan sejumlah besar perkhidmatan percuma untuk dagangan yang cekap.


