


Kumpulan kami mempunyai lebih daripada 7,000,000 pedagang!
Setiap hari kami bekerjasama untuk meningkatkan perdagangan. Kami mendapat keputusan yang tinggi dan bergerak ke hadapan.
Pengiktirafan oleh berjuta-juta pedagang di seluruh dunia adalah penghargaan terbaik untuk kerja kami! Anda membuat pilihan anda dan kami akan melakukan segalanya yang diperlukan untuk memenuhi jangkaan anda!
Kami adalah kumpulan yang terbaik bersama!
InstaSpot. Berbangga bekerja untuk anda!


Pelakon, juara kejohanan UFC 6 dan seorang wira sebenar!
Lelaki yang membuat dirinya sendiri. Lelaki yang mengikut cara kami.
Rahsia di sebalik kejayaan Taktarov adalah pergerakan berterusan ke arah matlamat.
Dedahkan semua segi bakat anda!
Cari, cuba, gagal - tetapi tidak pernah berhenti!
InstaSpot. Kisah kejayaan anda bermula di sini!

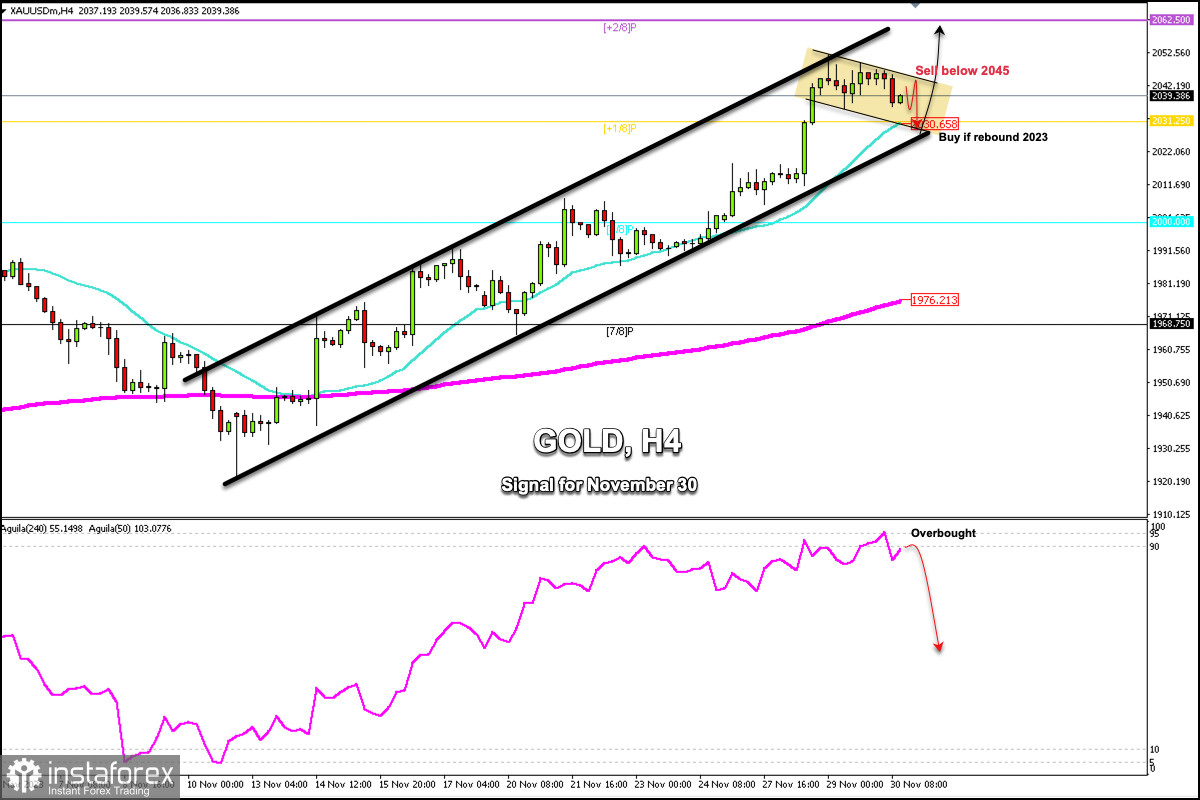
Early in the American session, Gold (XAU/USD) is trading around 2,039.38, above the 21 SMA, and within the uptrend channel formed since November 10.
Gold is staying firmly above the psychological $2,000 level, but the eagle indicator is giving a worrying signal for the bulls, as the price has been making lower highs. Hence, this could indicate a bearish divergence.
On the 4-hour chart, we can see that gold has formed a downtrend channel, having reached 2,052. It could indicate that in the short term, the instrument could fall towards the key support of the 21 SMA located at 2,030 or it could even reach the bottom of the uptrend channel around 2,023.
As long as gold trades within the uptrend channel, above the 21 SMA, and above +1/8 Murray, the bulls can be encouraged by the prospect of a strong move and the metal could reach +2/8 Murray at 2,062.
On the contrary, in case gold breaks the uptrend channel and consolidates below 2,020, we could expect a technical correction and the price could reach the psychological level of $2,000 around 8/8 Murray and even reach the 200 EMA located at 1,976.
Since November 29, the eagle indicator has been giving an extremely overbought signal. So, as long as the XAU/USD pair trades below the daily pivot point located at 2,045, this could be seen as a signal to sell with the target at 2,023.
* Analisis pasaran yang disiarkan di sini adalah bertujuan untuk meningkatkan kesedaran anda, tetapi tidak untuk memberi arahan untuk membuat perdagangan.
Kajian analisis InstaSpot akan membuat anda mengetahui sepenuhnya aliran pasaran! Sebagai pelanggan InstaSpot, anda disediakan sejumlah besar perkhidmatan percuma untuk dagangan yang cekap.


